 QA
QA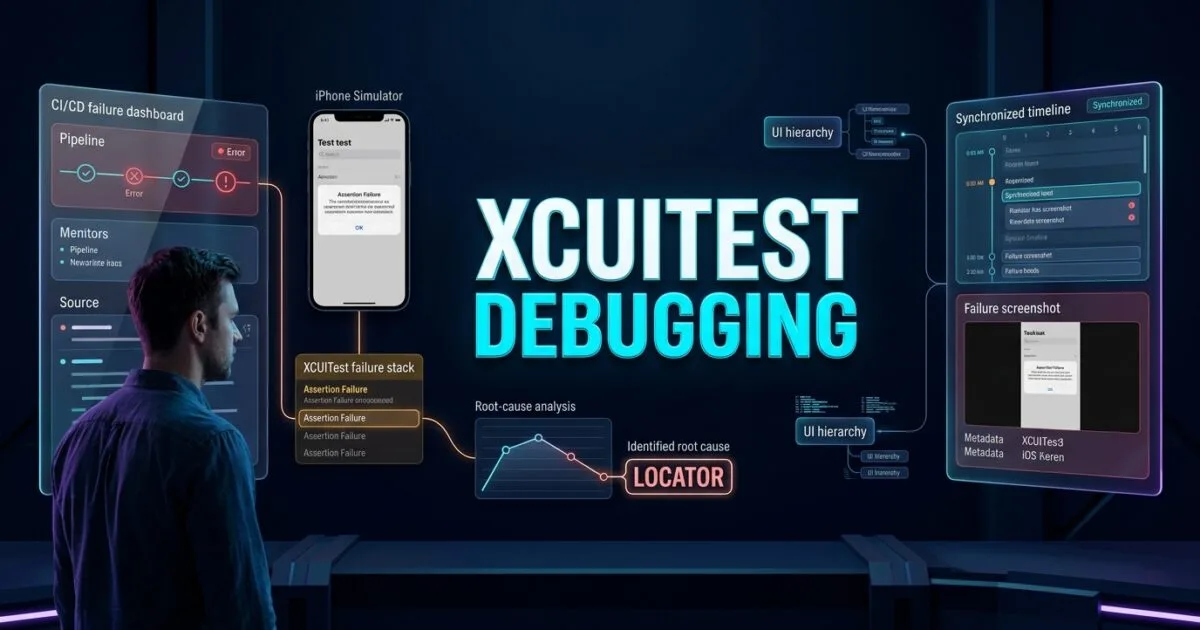
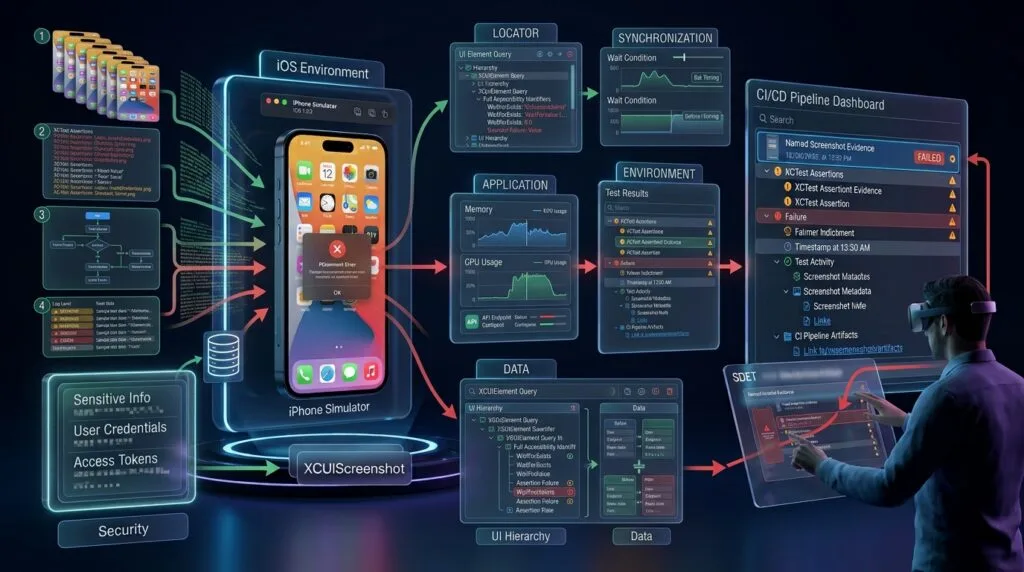
XCUITest debugging is where UI automation moves from simply writing tests to engineering reliable test systems. A failed XCUITest does not always mean the application is broken. The failure may come from an incorrect locator, synchronization problem, unexpected UI state, accessibility configuration, test data, environment, or automation code.
For an SDET, the goal is not simply to rerun the test. The goal is to identify the failure layer, collect evidence, reproduce the condition, isolate the root cause, and implement a stable fix.
Definition
XCUITest debugging is the systematic process of diagnosing, reproducing, and resolving failures in iOS UI automation tests built with XCTest and XCUITest.
A useful debugging process examines:
- Test code
- UI hierarchy
- Element queries
- Synchronization
- Application state
- Test data
- Network behavior
- Device or simulator state
- Accessibility identifiers
- Screenshots and attachments
- CI execution environment
Key Points
- Read the failure message before changing code.
- Identify the first meaningful failure.
- Inspect the UI hierarchy.
- Validate the locator.
- Check synchronization.
- Capture screenshots at failure points.
- Verify application state.
- Separate product defects from test defects.
- Reproduce locally and in CI.
- Fix root causes instead of adding arbitrary waits.
- Keep debugging utilities reusable.
Why XCUITest Failures Are Difficult
A UI test operates across multiple layers.
Test Code
   ↓
XCUITest API
   ↓
Accessibility / UI Hierarchy
   ↓
iOS Application
   ↓
Network / Backend
   ↓
Simulator or Device
A failure at one layer can appear as a failure at another.
For example:
app.buttons["Login"].tap()If the button does not exist, possible causes include:
- Wrong accessibility identifier
- Incorrect label
- Login screen not loaded
- Authentication state changed
- Network request still running
- Unexpected alert
- Application crash
- Wrong screen
- Test launched with incorrect state
Therefore, changing the locator immediately is not always the correct solution.
The SDET Debugging Mindset
A weak debugging approach is:
Test Failed
   ↓
Increase timeout
   ↓
Run Again
A stronger approach is:
Test Failed
   ↓
Read Failure
   ↓
Identify First Failure
   ↓
Collect Evidence
   ↓
Inspect UI State
   ↓
Check Query
   ↓
Check Synchronization
   ↓
Check Environment
   ↓
Reproduce
   ↓
Identify Root Cause
   ↓
Fix
   ↓
Run Regression
The second workflow produces more reliable automation.
6 Core Pillars of XCUITest Debugging
1. Failure Analysis
Understand exactly what failed before changing the test.
2. UI State Inspection
Determine what the application actually displayed.
3. Locator Validation
Verify that the query identifies the intended element.
4. Synchronization Analysis
Determine whether the test interacted with the UI too early.
5. Evidence Collection
Use screenshots, attachments, logs, and test activities.
6. Root Cause Isolation
Separate application defects, test defects, environment issues, and data problems.
XCUITest Debugging Workflow
flowchart TD
    A[Test Failure] --> B[Read Failure Message]
    B --> C[Find First Meaningful Failure]
    C --> D[Collect Screenshot and Test Evidence]
    D --> E[Inspect UI State]
    E --> F{Element Available?}
    F -->|No| G[Validate Locator]
    F -->|Yes| H{Correct UI State?}
    G --> I[Check Accessibility Identifier]
    H -->|No| J[Check Navigation and Synchronization]
    H -->|Yes| K[Check Assertion or Test Data]
    I --> L[Reproduce Failure]
    J --> L
    K --> L
    L --> M{Root Cause}
    M -->|Application| N[Fix Product]
    M -->|Automation| O[Fix Test]
    M -->|Environment| P[Fix Environment]
    M -->|Data| Q[Fix Test Data]
    N --> R[Run Regression]
    O --> R
    P --> R
    Q --> R
Read the Failure Before Editing the Test
Start with the actual XCTest failure.
Example:
Failed to find matching element
Query:
    Button
Identifier:
    Login
This does not automatically mean the Login identifier is wrong.
Ask:
- Was the login screen displayed?
- Was the application fully launched?
- Was another screen displayed?
- Was an alert covering the screen?
- Did a network request fail?
- Was the element disabled?
- Did the UI hierarchy change?
The failure message is the starting point, not the root cause.
Identify the First Failure
A test may produce several failures.
For example:
Launch failed
Element not found
Assertion failed
Screenshot unavailable
The most useful failure may be the first one.
If application launch failed, debugging the Login button query may waste time.
Use this principle:
Debug the earliest meaningful failure in the execution chain.
Inspect the UI Hierarchy
XCUITest interacts with the accessibility/UI hierarchy rather than the visual pixels directly.
If a query fails, inspect what XCUITest can actually see.
For example:
let loginButton = app.buttons["Login"]Ask:
Does the button exist?
Does it have the expected identifier?
Is it exposed as a button?
Is the label correct?
Is another element intercepting interaction?
A visually obvious button may still have a different accessibility representation.
Validate Element Queries
Consider:
let button = app.buttons["Login"]Instead of immediately doing:
button.tap()diagnose the query:
print(button.exists)
print(button.isHittable)
A useful debugging sequence is:
let loginButton = app.buttons["Login"]

print("Exists:", loginButton.exists)
print("Hittable:", loginButton.isHittable)
These values help distinguish between:
Element does not existand:
Element exists but cannot currently be interacted withDebugging Accessibility Identifiers
Stable accessibility identifiers are essential for reliable UI automation.
Prefer:
app.buttons["loginButton"]over fragile text-based queries when the application provides stable identifiers.
For example, production UI code might expose:
loginButton.accessibilityIdentifier = "loginButton"The test then uses:
app.buttons["loginButton"].tap()If the identifier changes, the automation may fail even though the UI looks identical.
Locator Debugging Checklist
When an element cannot be found, verify:
| Check | Question |
|---|---|
| Type | Is it actually a button, text field, image, or other element? |
| Identifier | Is the accessibility identifier correct? |
| Label | Has the visible/accessibility label changed? |
| Hierarchy | Is the element inside another container? |
| State | Is the element currently rendered? |
| Screen | Is the test on the expected screen? |
| Timing | Has the UI finished loading? |
| Overlay | Is another UI component covering it? |
Synchronization Problems
One of the most common causes of UI test instability is interacting with an element before it becomes available.
Fragile code:
app.buttons["Checkout"].tap()More resilient code:
let checkoutButton = app.buttons["Checkout"]

XCTAssertTrue(
    checkoutButton.waitForExistence(
        timeout: 10
    )
)

checkoutButton.tap()
waitForExistence(timeout:) allows the test to wait for an element to appear instead of immediately failing.
However, increasing every timeout is not a proper synchronization strategy.
Avoid Arbitrary Sleeps
This is usually a poor solution:
sleep(5)Why?
Because the application may become ready after:
0.5 secondsor:
7 secondsA fixed five-second delay is therefore unreliable.
Prefer waiting for the actual condition:
let dashboard = app.staticTexts["Dashboard"]

XCTAssertTrue(
    dashboard.waitForExistence(
        timeout: 10
    )
)
The test waits for something meaningful rather than waiting for an arbitrary duration.
Debugging isHittable
An element can exist without being interactable.
let button = app.buttons["Continue"]

print(button.exists)
print(button.isHittable)
Possible state:
exists = true
isHittable = false
This can indicate:
- Element is covered
- Element is outside the visible region
- Animation is still occurring
- Another UI element has focus
- Scroll position is incorrect
The solution should target the actual condition rather than forcing a tap.
Screenshot-Based Debugging
A screenshot can immediately reveal what happened.
let screenshot = app.screenshot()

let attachment = XCTAttachment(
    screenshot: screenshot
)

attachment.name = "Failure State"
attachment.lifetime = .keepAlways

add(attachment)
Useful failure screenshots can reveal:
Unexpected Alert
Wrong Screen
Loading State
Server Error
Empty State
Keyboard Visible
Permission Dialog
Authentication Failure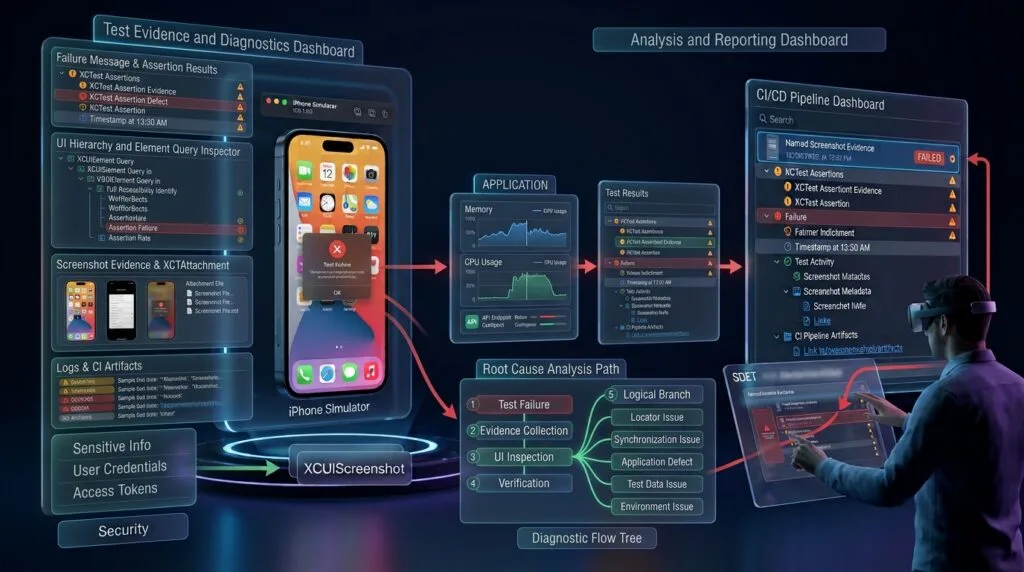
Debugging Failed Assertions
Suppose the test contains:
XCTAssertTrue(
    app.staticTexts["Welcome"].exists
)
and it fails.
Do not immediately replace the assertion.
First determine:
Was the application on the correct screen?
Was "Welcome" expected?
Did login succeed?
Was the network response successful?
Was another state displayed?
A screenshot can help answer these questions.
Assertion Failure vs Application Failure
An assertion failure does not automatically mean the application is defective.
For example:
XCTAssertEqual(
    app.staticTexts["Total"].label,
    "$100"
)
The test receives:
"$120"Possible explanations:
- Application calculation is wrong.
- Test data changed.
- Tax was added.
- Currency configuration changed.
- Test expected value is outdated.
- Backend returned different data.
The SDET must establish the actual root cause.
Debugging Test Data
Data-driven tests can fail because the data is invalid.
Example:
let email = "test@example.com"
let password = "Password123!"
If authentication fails, verify:
- Account exists.
- Account is active.
- Credentials are valid.
- Environment supports the account.
- Backend is reachable.
- Test data has not expired.
Avoid hardcoding assumptions about dynamic backend state.
Debugging Network-Dependent Tests
Network-dependent UI tests introduce additional failure sources.
XCUITest
   ↓
Application
   ↓
API Request
   ↓
Backend
   ↓
Database
A test failure may originate outside the UI.
Look for:
- HTTP failures
- Timeouts
- Authentication failures
- API contract changes
- Environment outages
- Invalid test data
- Slow responses
The UI test should not be blamed before these dependencies are investigated.
Debugging Alerts
An unexpected alert can block the intended UI interaction.
For example:
app.buttons["Checkout"].tap()may fail because a system or application alert is covering the screen.
Check:
if app.alerts.element.exists {
    print("Alert detected")
}
Then inspect its title, buttons, or message.
The correct solution depends on whether the alert is:
- Expected
- Unexpected
- Environment-specific
- Permission-related
- Application-generated
Debugging Keyboard Issues
Keyboard visibility can change the UI hierarchy and interaction behavior.
For text input:
let email = app.textFields["email"]

XCTAssertTrue(
    email.waitForExistence(timeout: 10)
)

email.tap()
email.typeText("qa@example.com")
If subsequent elements cannot be tapped, determine whether the keyboard is covering them.
Do not automatically add arbitrary delays.
Debugging Scroll Failures
A test may fail because an element exists but is not currently visible.
Example:
let table = app.tables["Products"]

let product = table.cells["Product 50"]
Before interacting, verify the UI state and scrolling behavior.
For large dynamic collections, reliable identifiers and deterministic scrolling strategies are preferable to repeated blind swipes.
Debugging Dynamic Content
Dynamic content can create intermittent failures.
Examples:
Loading
Refreshing
Pagination
Animation
Remote data
Lazy rendering
Async image loading
A test might search for:
app.staticTexts["Product 50"]before the item has been loaded.
Use condition-based synchronization and stable test data.
Debugging Intermittent Failures
Intermittent failures are particularly important for SDETs.
If a test passes:
Run 1 → PASS
Run 2 → PASS
Run 3 → FAIL
Run 4 → PASS
do not simply rerun it until it passes.
Investigate:
- Timing
- Network
- Test data
- Shared state
- Application state
- Simulator state
- Parallel execution
- Random data
- Race conditions
- External dependencies
An intermittent test is often a symptom of an uncontrolled dependency.
Debugging CI-Only Failures
A test may pass locally but fail in CI.
Compare:
| Area | Local | CI |
|---|---|---|
| Xcode | Version | Version |
| iOS | Runtime | Runtime |
| Device | Simulator | Simulator |
| Environment | Local | CI |
| Credentials | Local | CI |
| Network | Local | CI |
| Test Data | Local | CI |
| Parallelism | Maybe | Often |
| Timing | Different | Different |
The goal is to identify the environmental difference.
Test Evidence Architecture
A production XCUITest framework should collect multiple forms of evidence.
Test Failure
     ↓
┌────────────────────┐
│ Screenshot         │
│ Assertion          │
│ Activity           │
│ Logs               │
│ Error Message      │
│ Test Data          │
└────────────────────┘
     ↓
Root Cause Analysis
No single artifact tells the complete story.
Production Debugging Utility
A reusable debugging utility can standardize evidence collection.
import XCTest

enum DebugEvidence {

    static func screenshot(
        app: XCUIApplication,
        name: String,
        testCase: XCTestCase
    ) {
        let screenshot = app.screenshot()

        let attachment = XCTAttachment(
            screenshot: screenshot
        )

        attachment.name = name
        attachment.lifetime = .keepAlways

        testCase.add(attachment)
    }
}
Usage:
DebugEvidence.screenshot(
    app: app,
    name: "Checkout Failure State",
    testCase: self
)
This avoids duplicating attachment logic across tests.
Debugging with Activities
Logical activities make test reports easier to understand.
XCTContext.runActivity(
    named: "Submit Login"
) { activity in

    app.buttons["Login"].tap()

    let screenshot = app.screenshot()

    let attachment = XCTAttachment(
        screenshot: screenshot
    )

    attachment.name = "After Login Submission"

    activity.add(attachment)
}
This provides context around the action and its evidence.
Common Debugging Mistakes
Increasing Every Timeout
Longer waits can hide synchronization problems.
Using sleep()
Fixed delays do not synchronize with actual application state.
Changing Locators Without Investigation
A locator may be correct while the application is simply on the wrong screen.
Ignoring Screenshots
Text failures alone may not reveal the actual UI state.
Rerunning Until Green
Repeated reruns can hide flaky automation.
Blaming the Application Immediately
The failure may originate from test data, environment, or automation code.
Ignoring CI Differences
Local success does not guarantee CI reliability.
Best Practices
| Area | Best Practice |
|---|---|
| Failure | Investigate first meaningful failure |
| Locator | Use stable accessibility identifiers |
| Synchronization | Wait for meaningful conditions |
| Evidence | Capture useful screenshots |
| Assertions | Validate deterministic expectations |
| Network | Investigate external dependencies |
| Data | Use controlled test data |
| CI | Compare environments |
| Flakiness | Investigate root cause |
| Utilities | Centralize debugging logic |
Root Cause Classification
A useful SDET classification is:
Test Failure
    ↓
┌───────────────┬────────────────┬─────────────────┬────────────────┐
│ Automation    │ Application    │ Environment     │ Test Data     │
│ Defect        │ Defect         │ Issue           │ Issue         │
└───────────────┴────────────────┴─────────────────┴────────────────┘
Automation Defect
Examples:
- Incorrect locator
- Missing synchronization
- Invalid assertion
- Bad test setup
Application Defect
Examples:
- Incorrect UI
- Broken navigation
- Wrong calculation
- Application crash
Environment Issue
Examples:
- Backend unavailable
- Incorrect simulator
- Missing configuration
- CI infrastructure failure
Test Data Issue
Examples:
- Expired account
- Invalid credentials
- Missing records
- Unexpected backend state
This classification prevents teams from treating every failed test as a product defect.
Key Takeaways
XCUITest debugging requires more than reading an assertion failure and increasing a timeout.
A reliable SDET workflow should:
- Identify the first meaningful failure.
- Inspect the actual UI state.
- Validate element queries.
- Verify accessibility identifiers.
- Diagnose synchronization.
- Capture screenshots and attachments.
- Check application and network state.
- Validate test data.
- Compare local and CI environments.
- Separate automation, application, environment, and data failures.
- Fix the root cause rather than masking symptoms.
The objective is not merely to make the test pass once.
The objective is to make the test diagnostically useful, deterministic, and maintainable.
AI Overview & Answer Engine Optimization
XCUITest debugging is the process of diagnosing failed iOS UI automation by analyzing test code, UI state, element queries, synchronization, test data, environment conditions, and test evidence.
How Do You Debug a Failed XCUITest?
Start with the first meaningful failure, inspect the UI state, validate the locator, check synchronization, review screenshots and logs, reproduce the failure, and classify the root cause.
Why Does an XCUITest Fail to Find an Element?
Common causes include incorrect accessibility identifiers, wrong element types, incorrect screen state, asynchronous loading, overlays, navigation problems, or synchronization issues.
How Do You Debug XCUITest Synchronization?
Prefer condition-based waits such as:
element.waitForExistence(timeout: 10)instead of arbitrary delays such as:
sleep(5)How Do Screenshots Help Debug XCUITest Failures?
Screenshots show the application’s actual visual state when the test fails, helping identify unexpected screens, alerts, loading states, errors, and navigation problems.
How Do You Debug XCUITest Failures in CI?
Compare the CI and local environments, including Xcode, iOS runtime, simulator, configuration, credentials, network, test data, and parallel execution.
AI Overview Summary
To debug a failed XCUITest, identify the first meaningful failure, inspect the UI hierarchy and screenshot evidence, validate locators and accessibility identifiers, check synchronization and application state, investigate test data and environment differences, reproduce the issue, and classify the root cause before applying a fix.
People Asked Questions
What is XCUITest debugging?
It is the systematic investigation of failed iOS UI tests to determine whether the problem comes from automation code, the application, synchronization, data, or the execution environment.
What should I check first when an XCUITest fails?
Check the first meaningful failure and determine what the application was actually doing at that point.
Why does an XCUITest element exist but fail to tap?
The element may exist but not be hittable because of overlays, scrolling, animation, loading, or another UI state.
Should I use sleep() to fix XCUITest failures?
Generally, no. Prefer condition-based synchronization that waits for the expected application state.
How can screenshots help with XCUITest debugging?
They provide visual evidence of the application state at a particular point in test execution.
Why does an XCUITest pass locally but fail in CI?
Differences in Xcode, iOS runtime, simulator, network, credentials, data, timing, parallel execution, or environment configuration can cause CI-only failures.
How do I debug an incorrect XCUITest assertion?
Verify the expected value, actual value, application state, test data, backend response, and business logic before changing the assertion.
What makes an XCUITest flaky?
Common causes include timing races, asynchronous UI updates, unstable test data, network dependencies, shared state, animations, and environment differences.
Internal Blog Links
- XCUITest iOS Testing: What it is and Why it Matters
- XCTest vs XCUITest: Understanding Apple’s Testing Frameworks
- XCUITest Setup on macOS and Xcode: Complete Beginner’s Guide
- Your First XCUITest: Building a Basic iOS UI Test
- XCUITest Project Structure and Test Target Architecture
- XCUIApplication: Launching and Controlling iOS Apps
- XCUIElement: Finding and Interacting with UI Elements
- iOS Accessibility Identifiers: Build Reliable XCUITest Automation
- XCUITest Locators: IDs, Labels, Text and Element Queries
- XCUITest Actions: Tap, Type, Swipe, Scroll and Long Press
- XCUITest Assertions: Validating iOS App Behavior
- XCUITest Synchronization: Reliable Waiting for iOS UI Tests
- XCUITest Alerts: Handling Alerts, Sheets, Pop-Ups and System Dialogs
- XCUITest Form Testing: Automating Text Fields, Pickers and Keyboards
- XCUITest Collection Testing: Automating Tables, Lists and Dynamic Content
- XCUITest Page Object Model: Build Maintainable iOS UI Tests with Swift
- XCUITest Test Utilities: Build Reusable Helpers for Scalable iOS UI Automation
- XCUITest Data-Driven Testing: Build Scalable iOS UI Tests with Swift
- XCUITest Authentication Testing: Network, Login, and Secure iOS UI Scenarios
- XCUITest Screenshots: Capturing, Attaching, and Managing iOS Test Evidence
Internal Series Links
- Learn MCP – Zero to Hero
- Learn AI Agents for QA – Zero to Hero
- Playwright Automation – Zero to Hero
- TencentDB Agent Memory: Complete Zero to Hero
- LangGraph: Complete Zero to Hero
- Learn Python – Zero to Hero
- OpenAI Codex: Complete Zero to Hero
- Cursor AI: Complete Zero to Hero
- Claude Code Tutorial: Complete Zero to Hero
- AutoGen: Complete Zero to Hero Guide
- Free QA Resources Built From Real Experience
- QA Glossary: Test Automation Terms Every Engineer Should Know
External Links
- Apple — XCTest Documentation — Official documentation for XCTest, test cases, assertions, activities, attachments, and test execution.
- Apple — XCUITest / XCUIAutomation Documentation — Official documentation for iOS UI automation, UI elements, queries, applications, and interaction APIs.
- Apple — XCUIElement Documentation — Official API reference for querying and interacting with iOS UI elements.
- Apple — XCUIScreenshot Documentation — Official API reference for capturing UI screenshots during UI automation.
- Apple — XCTAttachment Documentation — Official API reference for attaching screenshots, files, images, and other test evidence.
- Apple — Activities and Attachments — Official documentation for organizing XCTest activities and attaching diagnostic evidence.
Continue Learning
Explore more expert articles on Mobile Testing, Backend & API, AI & Agentic, AI Tools, n8n, LangChain, CrewAI, MCP Servers, AI Agents, LlamaIndex, Docker, FastAPI, Playwright, Cypress, Test Automation, DevOps, and Software Engineering at www.skakarh.com.
QAPulse by SK delivers expert release analysis, AI engineering insights, enterprise automation strategies, migration guidance, DevOps best practices, and practical testing knowledge to help software professionals build scalable, intelligent, and production-ready software systems.