 QA
QA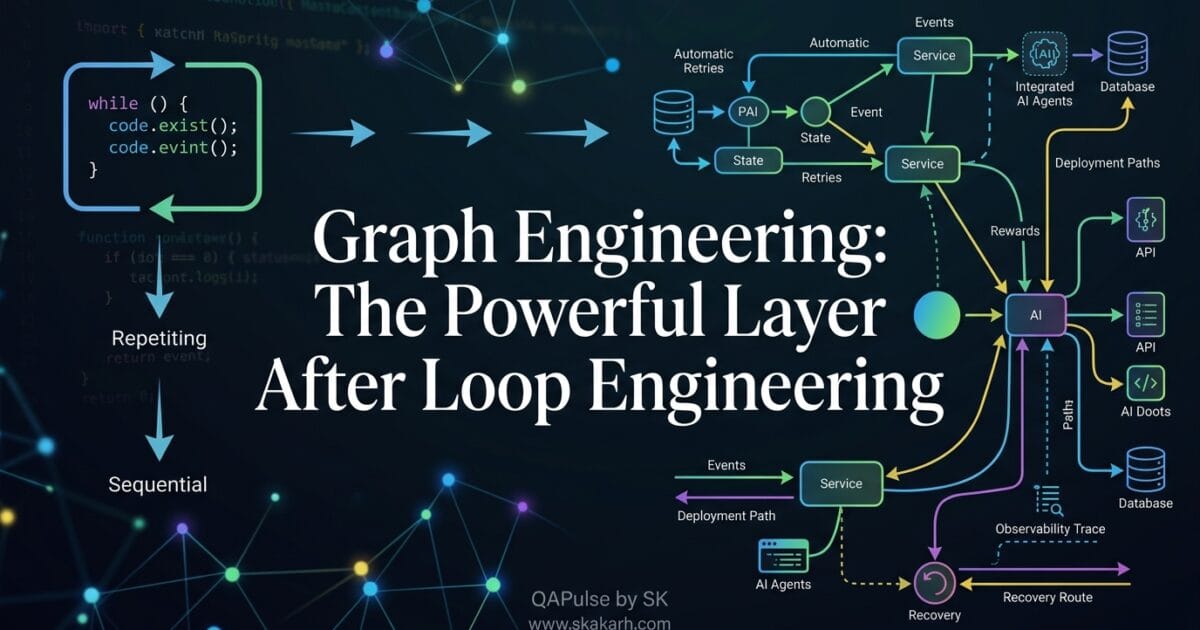
Graph Engineering is emerging as a useful way to think about software systems that have moved beyond simple linear execution. Traditional engineering often starts with sequential logic: receive an input, execute a function, evaluate a condition, repeat when necessary, and eventually produce an output. That model remains fundamental, but modern systems increasingly behave more like connected networks of states, dependencies, events, decisions, retries, and transitions.
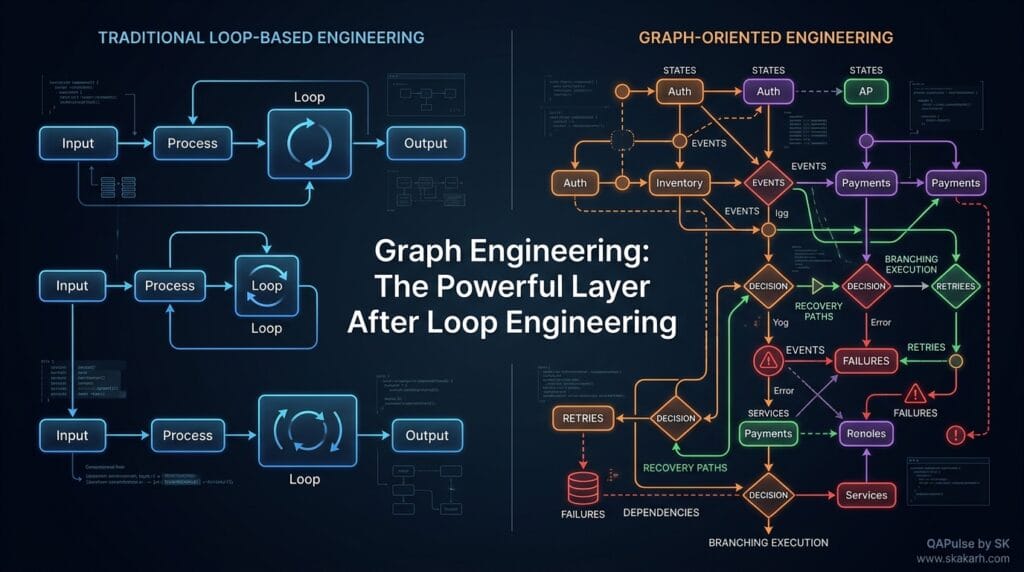
The important shift is not that loops are becoming obsolete. They are not. The shift is that loop engineering explains repeated computation, while graph engineering helps reason about relationships and paths across complex systems.
This distinction becomes especially important in distributed applications, workflow engines, event-driven architectures, AI agents, orchestration platforms, recommendation systems, data pipelines, and systems where one decision can send execution down several different paths.
Consider a conventional processing flow:
def process_order(order):
    validate(order)
    charge_payment(order)
    create_shipment(order)
    send_confirmation(order)
The execution model is relatively easy to understand:
Validate
   ↓
Payment
   ↓
Shipment
   ↓
Confirmation
Now introduce realistic behavior.
Payment can fail.
Payment can be retried.
Inventory can become unavailable after validation.
A shipment service can time out.
A confirmation event can be duplicated.
A fraud service can pause the order.
A customer can cancel the order while fulfillment is still processing.
The system is no longer adequately described by one straight line.
                 ┌── Payment Failed ──→ Retry
                 │                         │
Validate ────────┤                         ↓
                 └── Payment Approved → Fulfillment
                                           │
                         ┌─────────────────┤
                         ↓                 ↓
                    Shipment Failed   Shipment Created
                         │                 │
                         ↓                 ↓
                       Retry          Confirmation
This is where graph engineering becomes useful.
Instead of asking only, “What code executes next?”, engineers can ask:
- What states can the system enter?
- What transitions connect those states?
- Which paths are valid?
- Which paths are dangerous?
- Which transitions can happen more than once?
- What happens when an external dependency fails?
- Can the system recover?
- Can an unexpected event move the system into an invalid state?
- Which paths are most important to users and the business?
That is a fundamentally different way of reasoning about software.
From Sequential Thinking to Graph Thinking
Loop-based engineering is excellent for problems where repeated computation is the dominant concern.
For example:
for customer in customers:
    calculate_score(customer)
The engineer primarily needs to reason about:
- initialization,
- iteration,
- termination,
- data transformation,
- performance.
A graph introduces another dimension: relationships between execution states.
graph = {
    "created": ["validated", "cancelled"],
    "validated": ["payment_pending", "rejected"],
    "payment_pending": ["paid", "payment_failed"],
    "paid": ["fulfilled"],
    "payment_failed": ["payment_pending", "cancelled"],
    "fulfilled": ["completed"]
}
Now the system can be examined as a behavioral structure rather than merely a sequence of statements.
That distinction matters because many modern engineering problems are not difficult because of the amount of code. They are difficult because of the number of possible relationships between components and states.
A system with ten states and one transition between each state may be straightforward.
A system with ten states and dozens of possible transitions can produce a dramatically larger behavioral space.
This is the point at which graph engineering provides a stronger mental model.
What Is Graph Engineering?
Graph engineering is an engineering approach that models complex software behavior, dependencies, workflows, and execution paths as interconnected nodes and relationships.
A node might represent:
- an application state,
- a service,
- a workflow step,
- an event,
- a database state,
- an AI agent,
- a decision,
- a dependency,
- or an operational condition.
An edge represents a relationship or transition between those nodes.
For example:
User Request
     │
     ↓
API Gateway
     │
     ↓
Authentication
     │
 ┌───┴────┐
 ↓        ↓
Valid    Invalid
 │        │
 ↓        ↓
Service   Reject
 │
 ↓
Database
 │
 ↓
Event Bus
 ├─────────────→ Notification
 │
 └─────────────→ Analytics
The graph does not necessarily replace the underlying implementation.
It gives engineers another abstraction for understanding how the implementation behaves.
That distinction is critical.
Graph engineering is not simply “drawing architecture diagrams.”
A diagram is usually a communication artifact.
A graph-oriented engineering model can become an operational artifact that influences:
- execution,
- orchestration,
- testing,
- observability,
- dependency analysis,
- failure handling,
- optimization,
- and decision-making.
Why Loop Engineering Alone Can Become Insufficient
Loops are fundamental computational structures.
They solve problems such as:
while queue:
    item = queue.pop()
    process(item)
But imagine that process(item) can trigger several different behaviors:
                 ┌── Retry
                 │
Process Item ────┼── Success
                 │
                 ├── Dead Letter
                 │
                 └── Escalation
The loop controls repetition.
The graph describes what can happen inside and around that repetition.
This distinction becomes even more important in asynchronous systems.
A simplified event-driven architecture might look like:
Order Created
      ↓
Payment Service
      ↓
Payment Event
   ┌──┴──────┐
   ↓         ↓
Inventory   Fraud
   ↓         ↓
Reserve    Review
   │         │
   └────┬────┘
        ↓
   Order Decision
      ┌─┴─┐
      ↓   ↓
 Fulfill Reject
There is no single universal “next line.”
Different events and decisions determine the next state.
Graph engineering gives engineers a vocabulary for reasoning about that complexity.
A Practical Comparison
| Engineering approach | Primary abstraction | Best suited for | Main limitation |
|---|---|---|---|
| Sequential engineering | Ordered steps | Simple workflows | Weak at representing branching relationships |
| Loop engineering | Repetition | Iterative computation | Does not naturally express complex state relationships |
| Object-oriented engineering | Objects and interactions | Domain modeling | Relationships can become difficult to visualize at scale |
| Event-driven engineering | Events and handlers | Asynchronous systems | Behavior can become difficult to trace |
| Graph engineering | Nodes, edges, states, and paths | Complex interconnected behavior | Requires deliberate modeling and governance |
The important point is not to choose one approach and abandon everything else.
A mature engineering system can use all of them.
You might have:
Graph Architecture
       │
       ├── Services
       │      └── Object-oriented implementation
       │
       ├── Workflows
       │      └── Loops and conditional logic
       │
       ├── Events
       │      └── Event-driven processing
       │
       └── Validation
              └── Automated tests
Graph engineering sits above these implementation mechanisms as a way of reasoning about the larger behavioral structure.
The Most Important Concept: Paths
The real power of a graph is not simply the nodes.
It is the paths between them.
Suppose an authentication system has these states:
Logged Out
    ↓
Login Requested
    ↓
Authenticated
    ↓
Session Active
That looks simple.
Now introduce realistic behavior:
                         ┌── Invalid Credentials
                         ↓
Logged Out → Login Requested
                 │
                 ├── MFA Required
                 │       │
                 │       ↓
                 │    MFA Failed
                 │       │
                 │       ↓
                 │    MFA Retry
                 │
                 └── Authenticated
                         ↓
                    Session Active
                         │
                 ┌───────┴────────┐
                 ↓                ↓
             Session Expired   Logout
                 │                │
                 └───────┬────────┘
                         ↓
                     Logged Out
The happy path is easy.
The engineering challenge is everything surrounding it.
A graph-oriented approach forces the team to ask:
What happens on every meaningful transition?
That question exposes classes of problems that sequential reasoning can overlook.
For example:
- authentication succeeds but MFA state is not cleared;
- an expired session continues to access a protected resource;
- logout is processed twice;
- a retry creates duplicate sessions;
- an invalid transition is accepted by the backend;
- an event arrives after the state has already changed.
These are relationship problems.
Graph Engineering Is About Relationships
One of the strongest ways to understand graph engineering is to stop thinking primarily about individual components.
Instead, think about relationships.
A database is important.
A payment service is important.
An API is important.
An event broker is important.
But the system’s real behavior often emerges from the relationships between them.
For example:
Payment Service
      │
      │ publishes
      ↓
Payment Approved Event
      │
      ├────────→ Order Service
      │
      ├────────→ Inventory Service
      │
      └────────→ Notification Service
If the payment service works perfectly but the event is duplicated, the overall system can still fail.
If the event is correct but inventory processing is delayed, the workflow can still become inconsistent.
If every individual service passes its unit tests but the transitions between services are incorrect, the production system can still behave unexpectedly.
This is why graph engineering is particularly relevant to distributed systems.
The engineering question changes from:
“Does this component work?”
to:
“Does the system behave correctly across the relationships connecting these components?”
From Components to Behavioral Systems
Traditional architecture reviews often focus heavily on components:
Frontend
Backend
Database
Cache
Message Queue
External API
Graph thinking adds relationships:
Frontend
   ↓
API
   ↓
Authentication
   ↓
Order Service
   ├────────→ Database
   ├────────→ Payment
   └────────→ Event Bus
                    ├──→ Notification
                    ├──→ Analytics
                    └──→ Fulfillment
Now the engineer can ask questions that are difficult to answer from a component list:
- Which service transitions the order into
paid? - What happens if the payment event arrives twice?
- Which services depend on fulfillment completion?
- What happens when the event bus is unavailable?
- Which downstream states can be reached from a failed payment?
- Can an order reach
fulfilledwithout reachingpaid? - What happens if a cancellation event arrives during fulfillment?
These questions are where graph engineering becomes more than a visualization technique.
A Small Engineering Exercise
Take one workflow from your own system and write down only its states.
For example:
Created
Validated
Processing
Approved
Rejected
Completed
Cancelled
Failed
Now write down the transitions:
Created → Validated
Validated → Processing
Validated → Rejected
Processing → Approved
Processing → Failed
Approved → Completed
Processing → Cancelled
Failed → Processing
Then ask:
Which transitions would be dangerous if they happened when they should not?
For example:
Rejected → Completed
Cancelled → Approved
Failed → Completed
Completed → Processing
Those invalid transitions are often more interesting than the happy path.
That is the beginning of graph-oriented engineering thinking.
Why This Matters for Modern Software
Modern applications increasingly contain systems that naturally behave as graphs:
- microservice dependencies,
- event-driven architectures,
- workflow engines,
- CI/CD pipelines,
- data-processing pipelines,
- recommendation systems,
- authorization policies,
- distributed transactions,
- AI agent workflows,
- stateful APIs,
- dependency graphs,
- service meshes.
An AI agent is a particularly obvious example.
A simplistic view might be:
Prompt
  ↓
LLM
  ↓
Answer
A realistic agent may look more like:
User Request
      ↓
Intent Analysis
      ↓
Planning
   ┌──┴────┐
   ↓       ↓
Search   Tool Call
   │       │
   └──┬────┘
      ↓
Result Evaluation
   ┌──┴──────┐
   ↓         ↓
Sufficient  Insufficient
   │             │
   ↓             ↓
Response       Retry
                  │
                  └──→ Tool Call
Now the important engineering questions are about paths, state, retries, tool dependencies, and termination conditions.
That is precisely the type of complexity for which graph engineering provides a useful abstraction.
Graph Engineering and Software Quality
Graph thinking also changes how quality is evaluated.
A traditional engineering review might ask:
Does each component work correctly?
A graph-oriented review adds:
Does the system move correctly between components and states?
That difference matters.
A service can have 99% successful unit tests and still participate in a broken workflow.
A workflow can pass its happy-path integration test and still fail under:
- retries,
- duplicate events,
- partial failures,
- race conditions,
- timeout recovery,
- invalid state transitions,
- dependency outages,
- unexpected event ordering.
Graph engineering provides a structure for making these behaviors explicit.
The result is not simply a prettier architecture diagram.
It is a stronger engineering model for reasoning about behavior, connectivity, and system evolution.
Designing Systems Around States, Transitions, and Dependencies
Graph engineering becomes significantly more valuable when engineers stop treating the graph as a static architecture picture and start treating it as a model of system behavior.
A useful engineering graph should answer three questions:
- What can happen?
- What can happen next?
- What must never happen?
Those three questions sound simple, but they expose a major weakness in many system designs: teams frequently document components without documenting the behavioral relationships between those components.
Consider a payment workflow:
states = {
    "created": ["payment_pending", "cancelled"],
    "payment_pending": ["paid", "failed"],
    "paid": ["fulfillment"],
    "failed": ["payment_pending", "cancelled"],
    "fulfillment": ["completed", "delivery_failed"],
    "delivery_failed": ["fulfillment", "cancelled"],
    "completed": []
}
This small model immediately gives engineers something that a collection of service classes does not: a representation of allowed behavior.
Now introduce an invalid transition:
states["cancelled"] = ["paid"]
That may look like a small data-model mistake, but conceptually it represents a serious business problem. A cancelled transaction should not suddenly become paid without an explicit recovery or reversal process.
This is where graph engineering moves from visualization into engineering discipline.
State Is Not the Same as Data
One of the most important distinctions is between data state and system behavior.
A database row might contain:
{
  "order_id": "ORD-1042",
  "status": "paid"
}
That tells us the current value.
It does not necessarily tell us:
- how the order became paid,
- whether payment was attempted twice,
- whether inventory was reserved,
- whether a payment event was duplicated,
- whether the order was previously cancelled,
- whether a downstream service processed the payment event.
A behavioral graph can capture those relationships.
Created
   ↓
Payment Pending
   ↓
Payment Approved
   ↓
Inventory Reserved
   ↓
Fulfillment
   ↓
Completed
But production behavior may actually be:
Created
   ↓
Payment Pending
   ↓
Payment Approved
   ↓
Payment Event
   ├──→ Inventory Reserved
   ├──→ Analytics
   └──→ Notification
            ↓
       Notification Retry
The second model contains operational behavior that is invisible if engineers look only at the final database state.
This is one reason graph engineering is especially useful for distributed systems.
The Difference Between Structure and Behavior
A conventional dependency diagram might tell you:
Order Service → Payment Service
Order Service → Inventory Service
Order Service → Notification Service
That is useful.
But it does not tell you what happens when the dependencies behave differently.
A behavioral graph adds those possibilities:
                 ┌── Payment Success ──→ Inventory
                 │
Order Created ───┤
                 │
                 └── Payment Failure
                          │
                    ┌─────┴─────┐
                    ↓           ↓
                  Retry      Cancel
                    │
                    ↓
                Payment
Now the engineering discussion becomes more concrete.
The team can ask:
What happens if payment succeeds but the inventory service is unavailable?
That question may reveal the need for:
- event persistence,
- retry policies,
- idempotency,
- compensation,
- dead-letter handling,
- reconciliation,
- observability.
The graph has therefore become a reasoning tool for architecture decisions.
Graph Engineering vs Event-Driven Engineering
These approaches are related, but they solve different problems.
| Dimension | Event-driven engineering | Graph engineering |
|---|---|---|
| Primary focus | Events and reactions | States, relationships, and paths |
| Main abstraction | Event → handler | Node → transition → node |
| Strong at | Asynchronous communication | Behavioral reasoning |
| Failure analysis | Event delivery and processing | Invalid, missing, repeated, or unexpected paths |
| Visualization | Event flows | Behavioral topology |
| Testing benefit | Event-driven scenarios | Path and transition analysis |
| Main question | “What reacts to this event?” | “What paths can this system take?” |
A mature architecture can combine both.
For example:
Order Created
     ↓
Event Published
     ↓
Payment Service
     ↓
Payment Approved
     ↓
Event Published
     ↓
┌────┴─────────────┐
↓                  ↓
Inventory       Notification
Events provide the communication mechanism.
The graph provides a model for reasoning about the resulting behavioral network.
That distinction is strategically important because graph engineering should not be marketed as a replacement for event-driven architecture. It is better understood as a complementary engineering abstraction.
Where Loops Still Matter
There is an important misconception to avoid.
Graph engineering does not mean loops are obsolete.
Loops remain fundamental.
Consider retry logic:
for attempt in range(3):
    response = call_payment_service()

    if response.success:
        break
The loop is the correct implementation mechanism for repeated attempts.
But the larger behavioral model is:
Payment Pending
      ↓
   Attempt
   /     \
Success  Failure
   |       |
   |    Retry?
   |       |
   |    ┌──┴──┐
   |    ↓     ↓
   |  Retry  Cancel
   |    |
   |    └──→ Attempt
   ↓
Payment Complete
The loop answers:
How many times should we repeat?
The graph answers:
What states and transitions are possible around those repetitions?
Both perspectives are valuable.
This is why graph engineering should be considered an additional abstraction rather than an attempt to replace conventional programming constructs.
Cycles Are a Feature, Not Automatically a Bug
Graphs naturally contain cycles.
For example:
Payment Pending
      ↓
Payment Failed
      ↓
Retry
      ↓
Payment Pending
That cycle may be perfectly valid.
The engineering problem is determining whether it is:
- bounded,
- observable,
- recoverable,
- intentional,
- and safe.
A dangerous implementation might create:
Retry
  ↓
Payment Pending
  ↓
Failure
  ↓
Retry
  ↓
Payment Pending
  ↓
Failure
  ↓
...
Without a termination condition, the system can become trapped.
A robust implementation might explicitly control the cycle:
MAX_RETRIES = 3

if retry_count >= MAX_RETRIES:
    transition("dead_letter")
else:
    transition("payment_pending")
The corresponding model becomes:
Payment Failed
      ↓
Retry Count < 3?
   ┌──┴──┐
  Yes    No
   ↓      ↓
Retry   Dead Letter
   ↓
Payment Pending
This is a small example of how graph engineering can reveal failure modes before they become production incidents.
Graphs Make Hidden Paths Visible
A major benefit of graph-oriented thinking is that it exposes paths that teams may not consciously consider.
Imagine an account lifecycle:
Registered
    ↓
Verified
    ↓
Active
That is the obvious path.
But real systems may also support:
Registered
   ├──→ Verification Failed
   │         ↓
   │       Retry
   │         ↓
   └─────────┘

Active
   ├──→ Suspended
   │       ↓
   │    Review
   │       ↓
   │    Active
   │
   └──→ Deleted
Now the team can investigate every meaningful transition.
The important question is not:
“Do we have a test for registration?”
It is:
“Have we validated the meaningful paths through the account lifecycle?”
That change in thinking has direct consequences for architecture, testing, observability, and incident analysis.
A Practical Path-Analysis Technique
Take an important business workflow and categorize its paths into four groups:
| Path category | Example | Engineering priority |
|---|---|---|
| Happy path | Payment succeeds | High |
| Failure path | Payment fails | High |
| Recovery path | Failed payment succeeds after retry | High |
| Forbidden path | Cancelled order becomes fulfilled | Critical |
This simple classification can immediately improve design discussions.
For a more sophisticated system, add:
- frequency,
- business impact,
- security impact,
- recovery complexity,
- dependency count,
- historical failure rate.
You can then calculate a rough path risk score:
risk_score = (
    business_impact
    * failure_probability
    * dependency_factor
)
This does not need to be mathematically perfect to be useful.
The purpose is to make engineering prioritization explicit.
Graph Engineering and Observability
A graph model becomes even more powerful when connected to production telemetry.
Suppose an application has this workflow:
Request
  ↓
Authentication
  ↓
Authorization
  ↓
Order Creation
  ↓
Payment
  ↓
Fulfillment
Production traces can reveal that users frequently experience:
Request
  ↓
Authentication
  ↓
Authorization
  ↓
Order Creation
  ↓
Payment
  ↓
Payment Timeout
  ↓
Retry
  ↓
Payment
The theoretical architecture may show a clean path.
Production evidence shows a different behavioral reality.
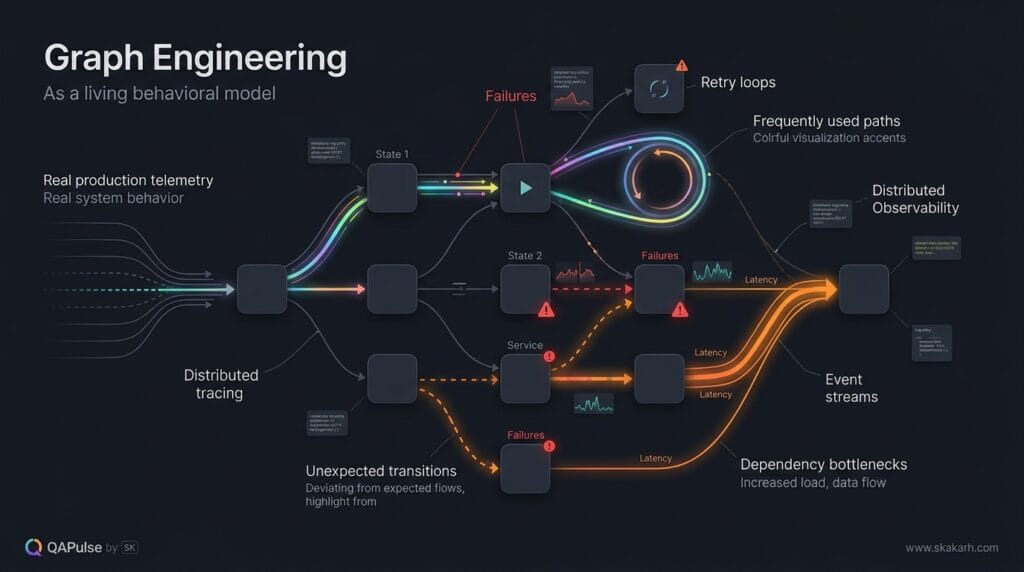
This is where observability changes graph engineering from a design exercise into a feedback loop.
Production Telemetry
        ↓
Behavioral Evidence
        ↓
Graph Model
        ↓
Unexpected Paths
        ↓
Engineering Investigation
        ↓
Architecture Improvement
        ↓
New Production Evidence
That feedback loop is particularly useful in systems where behavior changes continuously.
From Architecture Graph to Executable Graph
The next level is when the graph is not merely descriptive.
Consider a workflow represented in code:
workflow = {
    "start": ["validate"],
    "validate": ["approved", "rejected"],
    "approved": ["process"],
    "process": ["completed", "failed"],
    "failed": ["retry", "cancel"],
    "retry": ["process"],
    "rejected": ["end"],
    "cancel": ["end"],
    "completed": ["end"]
}
An execution engine can traverse that graph.
current = "start"

while current != "end":
    next_states = workflow[current]

    # Decision logic determines the next valid transition
    current = choose_transition(current, next_states)
Notice what happened.
The graph is no longer just documentation.
It now participates in execution.
This pattern appears in many modern technologies:
- workflow orchestration,
- state machines,
- agent frameworks,
- data pipelines,
- approval systems,
- business process automation,
- distributed orchestration.
The implementation still uses familiar programming constructs.
The graph simply becomes the higher-level representation of permissible behavior.
Graph Engineering in AI Systems
AI systems make this concept particularly interesting because their execution is often dynamic.
A simple AI application might look like:
Prompt
  ↓
Model
  ↓
Response
An agentic system can look very different:
User Request
      ↓
Planner
      ↓
Tool Selection
   ┌──┼────┐
   ↓  ↓    ↓
Search API DB  Calculator
   │  │    │
   └──┴────┘
      ↓
Result Evaluation
      ↓
Enough Information?
   ┌──┴──┐
  Yes    No
   ↓      ↓
Answer  More Tools
          │
          └────→ Evaluation
Now the system contains:
- branching,
- cycles,
- tool dependencies,
- decision nodes,
- termination conditions,
- failure states,
- potentially human approval.
Graph engineering provides a natural abstraction for such workflows.
Instead of thinking only about the prompt and final answer, engineers can reason about the execution topology.
That becomes especially valuable when debugging an agent that makes the correct decision on one path but fails on another.
Comparing Traditional Workflow Thinking With Graph Thinking
| Question | Traditional workflow view | Graph-oriented view |
|---|---|---|
| What happens? | Follow defined steps | Traverse states and transitions |
| Failure | Exception or error | Failure state/path |
| Retry | Loop or retry handler | Cycle in the graph |
| Branching | Conditional statement | Multiple outgoing edges |
| Recovery | Recovery code | Recovery transition |
| Dependency | Service reference | Connected node |
| Testing | Scenario execution | Path and transition validation |
| Observability | Logs and traces | Runtime evidence mapped to behavior |
| AI workflows | Prompt → response | Dynamic execution graph |
This does not mean one model is universally better.
The strategic advantage comes from using the appropriate abstraction for the problem.
A Useful Engineering Rule
A practical rule for teams is:
Use loops to control repetition, conditions to control decisions, events to communicate changes, and graphs to reason about the relationships and paths created by all of them.
This prevents graph engineering from becoming a buzzword.
It gives it a clear role in the engineering stack.
Business Requirements
        ↓
Behavioral Model
        ↓
Graph
   ┌────┼────┐
   ↓    ↓    ↓
States Events Dependencies
   ↓    ↓    ↓
Implementation
   ↓
Automation
   ↓
Observability
   ↓
Production Evidence
The graph becomes the connective layer between business behavior and technical execution.
The Engineering Payoff
When teams model complex systems as connected behavior rather than isolated components, several benefits become possible:
- better understanding of branching workflows;
- clearer failure and recovery behavior;
- explicit state-transition rules;
- easier dependency analysis;
- stronger integration design;
- better observability mapping;
- more deliberate automation strategies;
- improved incident investigation;
- clearer AI-agent orchestration;
- more meaningful coverage analysis.
But there is an important limitation.
Not every system needs a graph model.
A simple CRUD application with a handful of deterministic operations may gain little from introducing graph-oriented modeling everywhere.
The complexity must justify the abstraction.
A good engineering decision therefore asks:
Is the system highly stateful?
        ↓
Does it contain significant branching?
        ↓
Are there retries or recovery paths?
        ↓
Are multiple services or events involved?
        ↓
Are behavioral failures difficult to reproduce?
        ↓
Would explicit paths improve reasoning?
If most answers are yes, graph engineering can provide substantial value.
If most answers are no, conventional engineering abstractions may remain simpler and more effective.
A Strategic Adoption Model
Teams should avoid attempting to graph-model their entire platform on day one.
Start with one business-critical workflow.
For example:
Customer
   ↓
Order
   ↓
Payment
   ↓
Inventory
   ↓
Fulfillment
   ↓
Delivery
Then add realistic behavior:
Payment
 ├──→ Approved
 ├──→ Declined
 ├──→ Timeout
 └──→ Duplicate
Then add recovery:
Timeout
   ↓
Retry
   ↓
Payment
Then add production evidence:
Telemetry
   ↓
Actual Path Frequency
   ↓
Risk Analysis
   ↓
Engineering Priorities
This incremental approach is more sustainable than attempting to build a massive enterprise graph before the team understands why it needs one.
The strongest graph engineering implementations are not necessarily the largest.
They are the ones that make difficult behavior easier to understand, execute, observe, and improve.
Engineering for Path Explosion
The real challenge with complex systems is rarely the existence of a single path. It is the number of paths that emerge when states, events, retries, dependencies, and decisions interact.
Imagine a workflow with five independent binary decisions. Even before considering retries or asynchronous events, the number of possible combinations can grow rapidly.
decisions = 5

possible_paths = 2 ** decisions

print(possible_paths)
# 32
With ten binary decisions:
decisions = 10

print(2 ** decisions)
# 1024
This is why a system can appear simple when viewed component by component but become difficult when viewed through behavior.
Graph engineering gives teams a way to make that behavioral complexity explicit.
The objective is not to execute every theoretically possible path. That would often be impractical. The objective is to identify the paths that matter most.
A useful prioritization model is:
All Possible Paths
        ↓
Remove Impossible Paths
        ↓
Remove Duplicate/Equivalent Paths
        ↓
Identify Business-Critical Paths
        ↓
Identify Failure & Recovery Paths
        ↓
Prioritize High-Risk Paths
        ↓
Execute & Observe
This is where graph-oriented thinking becomes strategic rather than merely technical.
Risk-Based Graph Engineering
Not every node deserves equal attention.
Consider an e-commerce workflow:
Browse
  ↓
Add to Cart
  ↓
Checkout
  ↓
Payment
  ↓
Order Confirmed
A team could spend equal engineering effort on every transition.
That would not necessarily be the best decision.
A better approach considers risk.
| Transition | Frequency | Business Impact | Failure Cost | Priority |
|---|---|---|---|---|
| Browse → Product | High | Low | Low | Medium |
| Cart → Checkout | High | Medium | Medium | High |
| Checkout → Payment | High | High | High | Critical |
| Payment → Confirmation | High | Very High | Very High | Critical |
| Confirmation → Notification | Medium | Medium | Low | Medium |
| Payment → Retry | Medium | High | High | High |
This turns the graph into a prioritization mechanism.
For example, engineers might decide that payment transitions require:
- stronger idempotency guarantees;
- more detailed telemetry;
- additional resilience tests;
- stricter timeout handling;
- duplicate-event protection;
- reconciliation logic.
The graph helps explain why those areas deserve attention.
From Graph Topology to Engineering Decisions
A graph contains useful structural information.
For example:
                  ┌── Service A
                  │
Request → Gateway ┼── Service B
                  │
                  ├── Service C
                  │
                  └── Service D
The gateway has a high number of outgoing relationships.
That does not automatically make it a problem.
But it does make it an important architectural observation.
Now consider:
Service A ──→ Service B
Service C ──→ Service B
Service D ──→ Service B
Service E ──→ Service B
Service F ──→ Service B
Service B has become a highly connected dependency.
That could indicate:
- central business logic;
- a shared capability;
- an architectural bottleneck;
- excessive coupling;
- a potential single point of failure.
The graph therefore provides information that can guide architectural review.
Dependency Centrality Matters
One useful technique is to calculate how connected a component is.
A simple degree calculation might look like:
graph = {
    "gateway": ["auth", "orders", "payments"],
    "orders": ["database", "inventory"],
    "payments": ["fraud", "bank"],
    "inventory": ["database"]
}

degree = {
    node: len(edges)
    for node, edges in graph.items()
}

print(degree)
This is only a basic example.
Real graph analysis can consider:
- incoming relationships;
- outgoing relationships;
- shortest paths;
- dependency depth;
- strongly connected components;
- centrality;
- bottlenecks;
- cycles.
The important engineering principle is that graph analysis should produce a decision, not merely a metric.
If a component has unusually high connectivity, ask:
Is this intentional architecture or accidental coupling?
That question is more valuable than simply reporting a number.
Graph Engineering for Distributed Systems
Distributed systems are particularly suitable for graph-oriented reasoning because behavior is spread across services.
Consider a simple checkout platform:
Frontend
   ↓
API Gateway
   ↓
Checkout
   ├──→ Customer
   ├──→ Inventory
   ├──→ Payment
   └──→ Promotion
A successful request may traverse several services.
But a timeout could create:
Checkout
   ↓
Payment
   ↓
Timeout
   ↓
Retry
   ↓
Payment
   ↓
Success
Now imagine the first payment request actually succeeded but its response was lost.
The retry could potentially create a duplicate charge.
The graph makes that scenario visible:
Payment Request
      ↓
Bank Processing
      ↓
Charge Created
      ↓
Response Lost
      ↓
Retry
      ↓
Second Charge?
The engineering response might involve:
- idempotency keys;
- transaction identifiers;
- reconciliation;
- retry policies;
- timeout classification;
- distributed tracing.
This is a concrete example of how behavioral path analysis can uncover architecture requirements.
Graph Engineering and Idempotency
Idempotency is one of the most useful examples for demonstrating graph-oriented reasoning.
Suppose:
def process_payment(order_id):
    charge_customer(order_id)
    mark_order_paid(order_id)
A retry can execute the function twice.
The resulting behavior might be:
Request
  ↓
Charge
  ↓
Timeout
  ↓
Retry
  ↓
Charge Again
A safer implementation introduces an idempotency key:
def process_payment(order_id, idempotency_key):
    if already_processed(idempotency_key):
        return existing_result(idempotency_key)

    result = charge_customer(order_id)

    store_result(idempotency_key, result)

    return result
Now the graph includes an explicit decision:
Payment Request
      ↓
Idempotency Check
   ┌──┴──────┐
   ↓         ↓
Known     Unknown
   ↓         ↓
Return    Charge
Existing    │
Result      ↓
         Store Result
The graph has helped expose a design requirement that might otherwise be buried inside retry logic.
Graph Engineering and Failure Domains
Another important concept is the failure domain.
Imagine:
API
 ↓
Order
 ↓
Payment
 ↓
Bank
If the bank becomes unavailable, what should happen to the order?
Possible states include:
Payment Pending
      ↓
Bank Unavailable
      ↓
Retry Scheduled
      ↓
Payment Pending
Or:
Bank Unavailable
      ↓
Payment Failed
      ↓
Customer Notification
      ↓
Manual Recovery
The correct design depends on business requirements.
The graph makes the decision visible.
Instead of hiding recovery behavior inside exception handlers, engineers can explicitly model it.
That makes design reviews more concrete.
Graph Engineering and State Machines
Graph engineering has a close relationship with state machines.
A state machine typically defines:
- states;
- events;
- transitions;
- guards;
- actions.
For example:
transitions = {
    "draft": {
        "submit": "submitted",
        "delete": "deleted"
    },
    "submitted": {
        "approve": "approved",
        "reject": "rejected"
    },
    "approved": {
        "publish": "published"
    }
}
This provides a formal behavioral structure.
Graph engineering can use that structure while extending the reasoning to broader system relationships.
A useful distinction is:
| Concept | Primary concern |
|---|---|
| State machine | Valid state transitions |
| Graph | Relationships and paths |
| Workflow engine | Executing business processes |
| Dependency graph | Relationships between components |
| Event graph | Relationships between events |
| Service map | Relationships between services |
These concepts overlap, but they are not interchangeable.
Using the correct abstraction prevents architecture discussions from becoming terminology debates.
Graph Engineering and AI Agent Architecture
AI agents make graph-oriented architecture even more relevant because agents often perform dynamic multi-step reasoning.
A basic agent might follow:
Request
  ↓
Planner
  ↓
Tool
  ↓
Response
A production agent can behave more like:
                  ┌── Search
                  │
Request → Planner ┼── Database
                  │
                  └── API
                       ↓
                  Evaluate Result
                       ↓
                  Enough Evidence?
                    ┌──┴──┐
                   Yes    No
                    ↓      ↓
                 Respond  Retry
                            ↓
                         Planner
This introduces cycles.
It also introduces uncertainty.
A graph-oriented model can define:
- permitted tools;
- state transitions;
- retry boundaries;
- termination conditions;
- approval points;
- error states;
- escalation paths.
For example:
agent_graph = {
    "request": ["plan"],
    "plan": ["search", "database", "api"],
    "search": ["evaluate"],
    "database": ["evaluate"],
    "api": ["evaluate"],
    "evaluate": ["respond", "plan"],
    "respond": []
}
The important part is not that the graph exists.
The important part is that engineers can reason about what the agent is allowed to do.
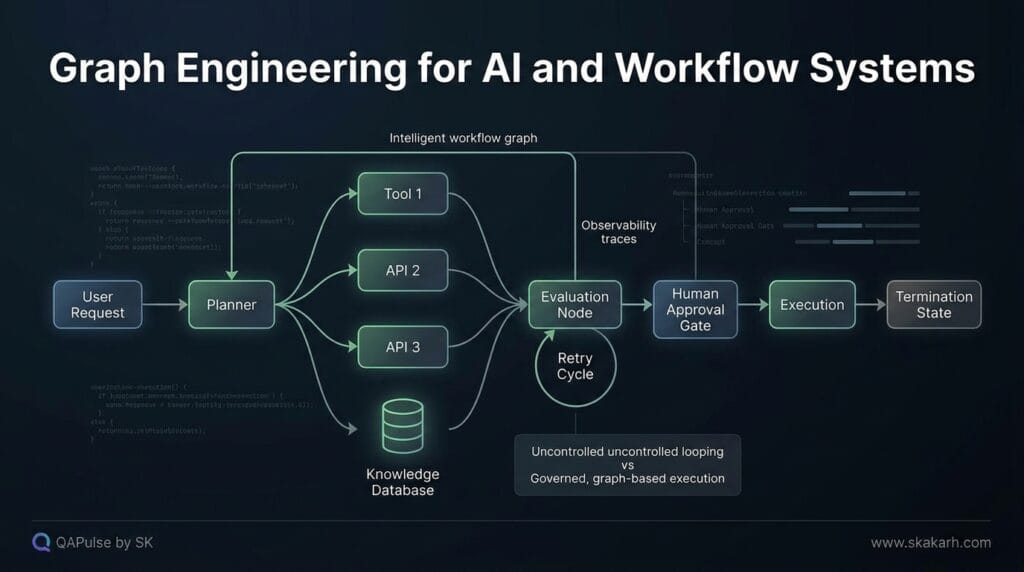
Guardrails Become Graph Constraints
Suppose an AI agent should never execute a destructive operation without approval.
A graph can represent that explicitly:
Request
   ↓
Plan
   ↓
Destructive Action?
   ├── No ──→ Execute
   │
   └── Yes
        ↓
   Human Approval
      ┌──┴──┐
     Yes    No
      ↓      ↓
   Execute  Stop
This is stronger than relying only on a prompt instruction such as:
“Ask the user before performing destructive operations.”
The graph can make the approval step a structural requirement.
That is an important engineering principle:
Safety-critical behavior should be enforced by system structure wherever possible, not only by instructions.
Graph Engineering and CI/CD
The same thinking can be applied to delivery pipelines.
A conventional CI/CD pipeline might appear as:
Build
 ↓
Unit Tests
 ↓
Integration Tests
 ↓
Deploy
Real pipelines contain branches:
                 ┌── Unit Failure
                 │
Build ───────────┤
                 │
                 └── Tests Pass
                       ↓
                 Integration Tests
                       ↓
                  ┌────┴────┐
                 Pass      Fail
                  ↓          ↓
                Deploy    Diagnose
                             ↓
                           Retry
Now add environments:
Build
 ↓
Test
 ↓
Staging
 ↓
Approval
 ↓
Production
A graph model can help answer:
- Which deployments require approval?
- Which failures automatically retry?
- Which failures stop the pipeline?
- Which environments can be skipped?
- Which deployment paths are reversible?
- Where does rollback begin?
- What happens if monitoring detects an incident after deployment?
The graph becomes a useful representation of delivery behavior.
Graph Engineering and Rollback Design
Rollback is often discussed as an operational procedure.
A graph makes it a state transition.
Production Deployment
        ↓
Monitoring
        ↓
Healthy?
     ┌──┴──┐
    Yes    No
     ↓      ↓
Continue  Rollback
             ↓
        Previous Version
             ↓
          Validate
This creates an important engineering question:
What happens if rollback itself fails?
A mature system may require:
Rollback
   ↓
Rollback Failed
   ↓
Incident Escalation
   ↓
Manual Recovery
The more critical the system, the more valuable explicit recovery paths become.
How to Know When a Graph Model Is Too Much
Graph engineering has a failure mode of its own: overengineering.
Not every CRUD endpoint needs a complex behavioral graph.
For a simple application:
Create
 ↓
Read
 ↓
Update
 ↓
Delete
A graph may provide little additional value.
But consider:
Create
 ├──→ Validate
 │      ├──→ Reject
 │      └──→ Approve
 │             ├──→ Payment
 │             │      ├──→ Success
 │             │      ├──→ Failure
 │             │      └──→ Retry
 │             └──→ Manual Review
 │
 └──→ Cancel
Here the graph becomes much more useful.
A practical rule is:
Introduce graph-oriented modeling when the number, importance, or uncertainty of relationships becomes difficult to reason about using linear documentation alone.
That keeps the technique purposeful.
A Practical Graph Engineering Adoption Checklist
Before introducing graph-oriented modeling into a project, ask:
□ Does the system have meaningful states?
□ Are there multiple execution paths?
□ Are retries part of normal behavior?
□ Are events processed asynchronously?
□ Are several services involved in one business workflow?
□ Can operations arrive out of order?
□ Are recovery paths important?
□ Are invalid transitions a business or security risk?
□ Is production behavior difficult to explain?
□ Would explicit path modeling improve design decisions?
If several answers are yes, start small.
Choose one critical workflow.
Model its states.
Add transitions.
Mark invalid transitions.
Identify cycles.
Add failure paths.
Connect production evidence.
Then use the model to make one engineering decision.
That is a much stronger adoption strategy than building a giant graph simply because graphs are fashionable.
The Connection Between Engineering and Testing
One of the most valuable consequences of graph-oriented architecture is that the same behavioral model can become useful to quality engineering.
Consider:
Order Created
      ↓
Payment Pending
      ↓
Payment Approved
      ↓
Inventory Reserved
      ↓
Fulfillment
      ↓
Completed
The engineering graph describes expected behavior.
The testing layer can ask:
Have we tested:

Created → Payment Pending?
Payment Pending → Approved?
Payment Pending → Failed?
Failed → Retry?
Failed → Cancelled?
Approved → Inventory Reserved?
Inventory Reserved → Fulfillment?
Fulfillment → Completed?
Now architecture and testing are speaking the same behavioral language.
That creates an important bridge between engineering and QA.
Instead of maintaining tests as an unrelated collection of scripts, teams can relate automation to system behavior.
This can improve:
- coverage analysis;
- regression planning;
- failure investigation;
- test prioritization;
- change impact analysis;
- production validation.
The architectural graph becomes a source of testable behavior.
The Stronger Engineering Model
The progression can therefore be understood as:
Loops
  ↓
Control Repetition

Conditions
  ↓
Control Decisions

Events
  ↓
Communicate Changes

Services
  ↓
Encapsulate Capabilities

Graphs
  ↓
Model Relationships and Paths

Observability
  ↓
Measure Actual Behavior

Automation
  ↓
Validate and Execute Behavior
These layers are complementary.
The goal is not to replace loops with graphs.
The goal is to recognize when the complexity of a system requires a higher-level representation.
Internal Blog Links
- 50 Playwright Commands Every QA Engineer Should Know
- Claude Code v2.1.233: GitLab MRs, Safer Builds, Smarter Sessions and MCP Fixes
- Mobile Regression Testing: A Practical Strategy for Reliable App Releases
- Kubernetes Upgrade Testing: How to Catch API Breaks Before Production
- Agentic Test Creation vs AI Test Generation: What’s the Real Difference?
- AI Test Automation With Humans in the Loop: Governance, Metrics, and the Practical Guide
Internal Series Links
- Learn MCP – Zero to Hero
- Learn AI Agents for QA – Zero to Hero
- Playwright Automation – Zero to Hero
- TencentDB Agent Memory: Complete Zero to Hero
- LangGraph: Complete Zero to Hero
- Learn Python – Zero to Hero
- OpenAI Codex: Complete Zero to Hero
- Cursor AI: Complete Zero to Hero
- Claude Code Tutorial: Complete Zero to Hero
- AutoGen: Complete Zero to Hero Guide
- Free QA Resources Built From Real Experience
- QA Glossary: Test Automation Terms Every Engineer Should Know
External Links
- Python documentation — for code examples and language behavior.
- OpenTelemetry documentation — for observability and distributed tracing.
- Kubernetes documentation — for distributed-system and deployment concepts.
- LangGraph documentation — for graph-based AI agent workflows.
People Asked Questions
What is graph engineering?
Graph engineering is an approach to software design that models systems as connected states, relationships, dependencies, events, and execution paths rather than viewing behavior only as sequential operations.
How is graph engineering different from loop-based programming?
Loop-based programming primarily handles repetition, while graph engineering focuses on relationships, paths, states, transitions, dependencies, and complex system behavior.
Why is graph engineering important for distributed systems?
Distributed systems contain multiple services, asynchronous events, retries, dependencies, and failure paths. Graph-oriented modeling makes those relationships easier to analyze.
Is graph engineering only useful for AI systems?
No. Graph engineering can be applied to distributed systems, workflows, CI/CD pipelines, dependency management, event-driven architectures, state machines, and AI agents.
How does graph engineering help AI agents?
It can represent agent states, tool calls, decisions, retries, evaluation steps, approval gates, and termination conditions, making agent behavior easier to control and reason about.
Does graph engineering replace traditional programming?
No. Graph engineering complements traditional programming techniques. Loops, conditions, functions, events, and services remain fundamental; graphs provide a higher-level way to model their relationships.
When should engineers use graph engineering?
Graph-oriented modeling becomes useful when system behavior contains enough states, dependencies, paths, retries, events, or recovery scenarios that linear documentation becomes difficult to reason about.
What is the relationship between graph engineering and graph testing?
Graph engineering models the system’s behavioral and architectural relationships, while graph testing uses those relationships to identify and validate important paths, transitions, states, and failure scenarios.
AI Overview Optimization
Graph engineering is a software engineering approach for modeling relationships, states, transitions, dependencies, events, and execution paths as interconnected structures. It complements loop-based programming by helping engineers reason about complex workflows, distributed systems, AI agents, CI/CD pipelines, and recovery behavior.
Graph Engineering → Software Architecture → Distributed Systems → State Machines → Workflow Engines → Event-Driven Systems → AI Agents → Observability → CI/CD → Graph Testing
Loops control repetition. Graphs model relationships and paths. A loop can repeatedly execute an operation, while a graph can represent how multiple states, services, events, retries, and decisions connect.
AEO Optimization
What is graph engineering?
Graph engineering is a software engineering approach that models complex systems through connected states, relationships, dependencies, events, decisions, and execution paths. It complements traditional loop-based programming by making complex behavioral paths easier to design, analyze, observe, and control.
Graph Engineering vs Loop Engineering
| Loop Engineering | Graph Engineering |
|---|---|
| Focuses on repetition | Focuses on relationships and paths |
| Executes repeated operations | Models connected states and transitions |
| Usually represents local control flow | Can represent system-level behavior |
| Works well for predictable iteration | Works well for branching and interconnected behavior |
| Primarily sequential within the loop | Can contain branches and cycles |
Example: for / while | Example: workflow or state graph |
Conclusion
Graph engineering becomes valuable when software behavior can no longer be adequately understood as a sequence of isolated operations.
Loops remain essential for repeated computation. Conditions remain essential for decisions. Events remain essential for asynchronous communication. Services remain essential for encapsulating capabilities.
But when those mechanisms combine, they create something larger: a network of states, transitions, dependencies, retries, events, and paths.
That network is where graph engineering provides its greatest value.
The most practical way to adopt it is not to redesign everything around graphs. Start with a high-value workflow, model its states and transitions, identify failure and recovery paths, connect those paths to production evidence, and use the resulting model to make better engineering decisions.
The real opportunity is not drawing more diagrams.
It is making system behavior explicit enough to reason about, constrained enough to govern, observable enough to measure, and structured enough to improve.
That is the layer that becomes increasingly important as software evolves from straightforward request-response applications into distributed, event-driven, AI-powered systems.
Final Key Takeaways
- Graph engineering complements rather than replaces loop-based engineering.
- Loops are excellent for repetition; graphs are useful for reasoning about relationships and paths.
- Complex software should be analyzed through states, transitions, dependencies, events, and recovery behavior.
- Not every theoretical path needs to be executed; prioritize paths using business and technical risk.
- High-connectivity components can reveal important architectural dependencies and potential coupling.
- Retry behavior should be modeled explicitly because cycles can create both resilience and failure risks.
- Idempotency problems become easier to reason about when retries are represented as behavioral paths.
- Distributed systems benefit from connecting architecture graphs with production telemetry and distributed traces.
- AI agent workflows naturally benefit from graph-oriented modeling because they contain tools, decisions, loops, evaluations, and termination conditions.
- Safety-critical AI behavior can be strengthened by enforcing approval and execution constraints structurally.
- CI/CD workflows can also be modeled as graphs to make deployment, rollback, approval, and recovery paths explicit.
- Graph-oriented engineering should be introduced only when system complexity justifies the abstraction.
- The strongest implementation connects architecture, execution, observability, and testing through a shared behavioral model.
- The ultimate goal is not to create a graph for its own sake; it is to make complex system behavior easier to understand, govern, validate, and evolve.
Continue Learning
Explore more expert articles on Mobile Testing, Backend & API, AI & Agentic, AI Tools, n8n, LangChain, CrewAI, MCP Servers, AI Agents, LlamaIndex, Docker, FastAPI, Playwright, Cypress, Test Automation, DevOps, and Software Engineering at www.skakarh.com.
QAPulse by SK delivers expert release analysis, AI engineering insights, enterprise automation strategies, migration guidance, DevOps best practices, and practical testing knowledge to help software professionals build scalable, intelligent, and production-ready software systems.