 QA
QA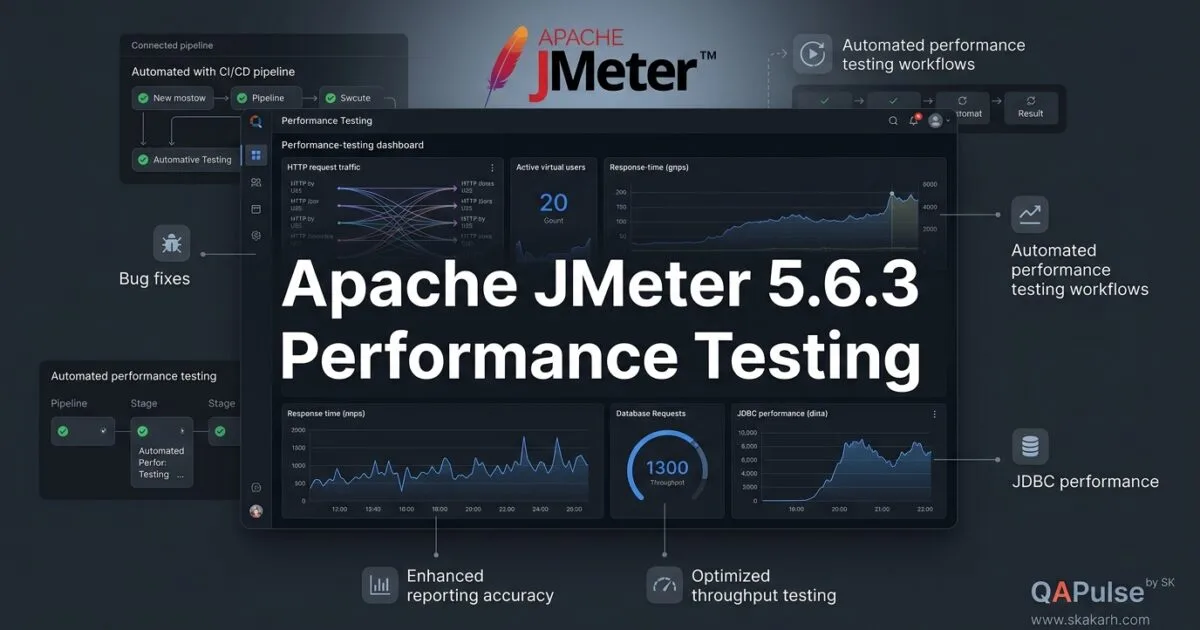
Apache JMeter 5.6.3 is a maintenance release, but its changes are more useful than a typical “bug-fix only” update might suggest. For performance engineers, SDETs, developers, and teams running repeatable load tests, this release improves several areas that directly affect how confidently you can build, execute, observe, and troubleshoot performance tests.
Released on January 9, 2024, Apache JMeter 5.6.3 includes fixes around throughput timers, summary-report calculations, startup error logging, JDBC row handling, build tooling, and test-framework modernization. The important question is not simply “What changed?” but rather:
Do these changes make your performance tests more trustworthy?
That is the lens we should use when evaluating a JMeter release.


Why Apache JMeter 5.6.3 Matters Beyond a Version Number
Performance testing has an uncomfortable property: a technically successful test can still produce misleading results.
Your JMeter test may execute thousands of requests without errors while the workload itself is incorrectly modeled.
For example, suppose your requirement is:
Target throughput: 600 requests/minute
Expected response time: < 500 ms
Concurrent users: 100
If your throughput timer behaves differently from what your test plan assumes, your test may generate the wrong workload.
The application could appear healthy simply because the test never applied the intended pressure.
This is why changes in Apache JMeter 5.6.3 around throughput timers are particularly interesting.
A performance engineer should think about a JMeter upgrade through four questions:
| Question | Why it matters |
|---|---|
| Does the workload execute correctly? | Prevents invalid performance conclusions |
| Are metrics calculated correctly? | Prevents misleading reports |
| Can failures be diagnosed? | Reduces investigation time |
| Can the test interact with dependencies efficiently? | Improves test realism |
This approach is much more useful than simply copying a release changelog into a blog post.
The Most Important Change: Throughput Timer Variables
One of the notable changes in Apache JMeter 5.6.3 is support for variables in the throughput configuration of:
ConstantThroughputTimerPreciseThroughputTimer
This matters when you want the same test plan to support different workload profiles.
Imagine you have:
Smoke       → 60 requests/minute
Baseline    → 300 requests/minute
Stress      → 600 requests/minute
Spike       → 1,000 requests/minute
Without parameterization, you might create separate test plans or manually change timer values.
A variable-driven approach is much more scalable.
For example:
${TARGET_THROUGHPUT}
can represent the workload selected for the current test execution.
You can then inject the value through JMeter properties or your CI/CD pipeline.
A conceptual command could look like:
jmeter \
  -JTARGET_THROUGHPUT=600 \
  -n \
  -t performance-test.jmx \
  -l results.jtl
The important idea is not the command itself.
The strategic improvement is separating workload configuration from test logic.
Your test plan describes what to test.
Your pipeline determines how much load to apply.
That separation makes performance testing easier to automate.
Why Parameterized Throughput Is Valuable in CI/CD
Consider a team running the same JMeter test at different stages.
Pull Request
     ↓
Smoke workload
     ↓
Nightly regression
     ↓
Baseline workload
     ↓
Pre-production
     ↓
Stress workload
Instead of maintaining three nearly identical .jmx files, you can maintain one workload model and change the throughput externally.
For example:
# Smoke
jmeter -JTARGET_THROUGHPUT=60 -n -t api.jmx

# Baseline
jmeter -JTARGET_THROUGHPUT=300 -n -t api.jmx

# Stress
jmeter -JTARGET_THROUGHPUT=1000 -n -t api.jmx
This is particularly useful for SDETs because performance tests can become part of the same automation strategy used for functional testing.
A Better Performance-Test Architecture
A mature performance-testing repository might look like:
performance-tests/
├── scenarios/
│   ├── login.jmx
│   ├── checkout.jmx
│   └── search.jmx
├── config/
│   ├── smoke.properties
│   ├── baseline.properties
│   └── stress.properties
├── scripts/
│   └── run-jmeter.sh
└── reports/
The test scenario remains stable while workload configuration changes.
That is a much better engineering model than cloning test plans for every load profile.
ConstantThroughputTimer vs PreciseThroughputTimer
These two timers deserve particular attention because they solve related but different workload-control problems.
| Capability | ConstantThroughputTimer | PreciseThroughputTimer |
|---|---|---|
| Primary purpose | Maintain target throughput | Precisely schedule throughput |
| Workload control | Throughput-oriented | More timing-oriented |
| Use case | General rate control | More precise request scheduling |
| Parameterization | Supported with release improvement | Supported with release improvement |
| Best fit | Stable workload generation | Precise performance experiments |
The correct choice depends on what you are trying to measure.
If your question is:
“Can the system sustain approximately this request rate?”
a throughput-oriented approach may be sufficient.
If your question is:
“Can I reproduce a carefully controlled request schedule?”
precision becomes much more important.
This distinction is often overlooked when teams treat all load tests as simply “send many requests.”
A Performance Test Is a Workload Model, Not Just a Script
This is one of the most important concepts to understand.
A JMeter test plan is not merely an automated sequence of HTTP requests.
It represents a workload model.
For example:
User arrives
   ↓
Login
   ↓
Browse products
   ↓
Search
   ↓
Open product
   ↓
Add to cart
   ↓
Checkout
Now add realistic behavior:
Arrival rate
    ↓
Concurrent users
    ↓
Think time
    ↓
Request distribution
    ↓
Data variation
    ↓
Backend dependencies
That becomes a performance model.
A bug or behavioral change in workload generation can therefore affect the validity of your entire experiment.
This is why the throughput-related changes in Apache JMeter 5.6.3 deserve more attention than their small changelog entry might suggest.
Summary Report Calculation Fix
Another important change fixes the computation of the minimum value in the Summary Report.
At first glance, this might appear insignificant.
It isn’t.
Performance testing depends heavily on statistical interpretation.
Suppose your results contain:
Response times:

120 ms
130 ms
145 ms
180 ms
220 ms
The minimum is:
120 ms
Now imagine the reporting layer incorrectly calculates or presents that value.
The test itself may have executed correctly, but the analysis becomes unreliable.
That creates a dangerous distinction:
A correct test with incorrect reporting is still an incorrect performance decision.
Performance engineers should therefore validate not only request execution but also metric integrity.
What Metrics Should You Validate?
At minimum, monitor:
| Metric | What it tells you |
|---|---|
| Average | Overall central tendency |
| Median | Typical user experience |
| p90 | Higher-end latency |
| p95 | Important tail behavior |
| p99 | Severe tail latency |
| Min | Best observed response |
| Max | Worst observed response |
| Throughput | Work completed per unit time |
| Error rate | Functional reliability under load |
Do not make an upgrade decision from average response time alone.
Consider this example:
Average: 210 ms
p95:     480 ms
p99:     2,400 ms
Errors:  0.8%
The average looks healthy.
The tail does not.
A mature performance strategy therefore asks:
What happened to the slowest users?
rather than:
“What was the average response time?”
Startup Error Logging Becomes More Useful
Apache JMeter 5.6.3 also includes a fix to log errors that occur while JMeter starts a test.
This is important for automation.
Imagine a CI job executing:
jmeter -n \
  -t test-plan.jmx \
  -l results.jtl
The job fails.
Without useful startup diagnostics, engineers may waste time asking:
Is the JMX file broken?
Is Java incompatible?
Is the configuration invalid?
Is the plugin missing?
Did the test actually start?
Did the infrastructure fail?
Better startup logging reduces this ambiguity.
For automated performance testing, diagnostic quality is part of test quality.
A test that fails without explaining why is expensive to operate.
JMeter in CI/CD: Why Diagnostics Matter
Consider this pipeline:
Git Push
   ↓
Build
   ↓
Deploy to Test Environment
   ↓
Run JMeter
   ↓
Collect Results
   ↓
Evaluate Thresholds
   ↓
Pass / Fail
If JMeter fails during startup, you want the pipeline to expose the actual reason.
For example:
Performance Test
Status: FAILED

Cause:
JMeter startup configuration error

Action:
Inspect JMeter startup logs
rather than:
Performance Test FAILED
Exit code: 1
The difference is operationally significant.
JDBC Sampler Gets Better Control Over Database Rows
Apache JMeter 5.6.3 also changes JDBC sampler behavior by passing JDBCSampler.maxRows to Statement.setMaxRows.
This is relevant for database-heavy performance tests.
Suppose a query returns:
SELECT *
FROM orders
WHERE customer_id = ?
and the database contains hundreds of thousands of matching rows.
If the test only needs the first 100 rows, retrieving substantially more data than necessary can distort the test.
You might configure:
Max Rows = 100
The database interaction then becomes more controlled.
The broader principle is:
A performance test should control the amount of data it retrieves, not accidentally benchmark unnecessary data transfer.
This becomes especially important when testing:
- JDBC APIs
- reporting services
- search endpoints
- data-heavy microservices
- analytics workloads
- backend integrations
JMeter vs k6: Different Performance-Test Philosophies
It is useful to compare JMeter with modern alternatives such as k6.
| Area | Apache JMeter | k6 |
|---|---|---|
| Test definition | GUI + JMX | JavaScript |
| Protocol coverage | Very broad | Strong HTTP/API focus |
| GUI workflow | Strong | Minimal |
| Distributed testing | Mature | Supported |
| CI/CD experience | Strong | Very strong |
| Non-HTTP protocols | Major advantage | More limited |
| Learning curve | Moderate | Often easier for developers |
| Plugin ecosystem | Large | Smaller |
| Best fit | Broad performance testing | Developer-centric load testing |
This doesn’t mean one tool is universally better.
If your organization already has a large JMeter ecosystem, replacing it because another tool looks newer may create more problems than it solves.
Instead ask:
Does the current tool model our workload correctly?
Can we automate it?
Can we analyze results reliably?
Can we maintain the test suite?
Those questions matter more than tool popularity.
JMeter vs Gatling
Gatling takes another approach.
It emphasizes code-driven performance testing.
For example, a conceptual Gatling scenario might look like:
scenario("Checkout")
  .exec(http("Open checkout")
    .get("/checkout"))
  .pause(2)
  .exec(http("Submit order")
    .post("/orders"))
JMeter, by contrast, allows teams to visually construct test plans.
This creates an important organizational trade-off.
JMeter can be attractive when:
- testers prefer visual test construction
- teams already have JMX assets
- many protocols are involved
- existing plugins are important
- distributed execution is established
Code-driven tools can be attractive when:
- developers own performance tests
- tests are heavily code-reviewed
- Git-based workflows dominate
- infrastructure-as-code principles are preferred
The right decision depends on your team rather than a generic “modern tool versus old tool” argument.
What Apache JMeter 5.6.3 Means for Test Automation
The release should not be evaluated only from the perspective of someone manually opening JMeter.
Think about the complete automation chain:
Test Code
   ↓
Configuration
   ↓
Workload
   ↓
JMeter Execution
   ↓
Metrics
   ↓
Threshold Evaluation
   ↓
CI/CD Decision
A weakness anywhere in this chain can invalidate the result.
For example:
Correct API
    +
Correct test
    +
Wrong throughput
    =
Wrong conclusion
Or:
Correct workload
    +
Correct execution
    +
Incorrect metric calculation
    =
Wrong conclusion
This is why performance engineering should be treated as an engineering discipline rather than simply running load tests.
Build a Release Validation Test Before Upgrading
Before introducing Apache JMeter 5.6.3 into a large performance-testing environment, create a small release-validation suite.
For example:
jmeter-upgrade-validation/
├── api-smoke.jmx
├── jdbc-smoke.jmx
├── throughput-test.jmx
├── reporting-test.jmx
└── expected-results/
Validate:
✓ Test plan opens
✓ Plugins load
✓ Variables resolve
✓ Throughput values resolve
✓ HTTP requests execute
✓ JDBC samplers execute
✓ Reports are generated
✓ Metrics remain consistent
✓ CI exit codes remain correct
This is much safer than upgrading JMeter and immediately launching a production-scale load test.
Use a Baseline Before Comparing Versions
Suppose your current version produces:
Average: 240 ms
p95:     420 ms
p99:     780 ms
Throughput: 500 req/s
Errors: 0.2%
After upgrading, you receive:
Average: 220 ms
p95:     390 ms
p99:     700 ms
Throughput: 510 req/s
Errors: 0.2%
It is tempting to say:
“The new JMeter version made our application faster.”
That conclusion is wrong.
JMeter is the measurement mechanism.
You changed the measurement environment.
Therefore, you should repeat the experiment under controlled conditions before attributing differences to the application.
A better approach is:
Old JMeter
    ↓
Baseline
    ↓
Controlled environment
    ↓
New JMeter
    ↓
Repeat baseline
    ↓
Compare
This separates tool behavior from system behavior.
Upgrade Testing Should Be Repeatable
A strong JMeter upgrade strategy includes:
1. Freeze test data
2. Freeze environment
3. Record current JMeter version
4. Capture baseline results
5. Upgrade JMeter
6. Run smoke validation
7. Run workload validation
8. Compare metrics
9. Run CI/CD validation
10. Approve or roll back
This approach is especially valuable when JMeter is part of an organization’s release gate.
The goal isn’t simply to prove that the new version starts.
The goal is to prove that:
The new version still produces trustworthy performance evidence.
How to Install Apache JMeter 5.6.3 Correctly
One correction is important here: Apache JMeter is not normally installed through pip install or npm install.
JMeter is a Java-based application and should be installed using the official distribution appropriate for your environment.
After installation, verify the version:
jmeter --version
or use:
jmeter -v
depending on the distribution and environment.
For CI/CD, keep the JMeter version explicit rather than silently pulling an arbitrary latest release.
For example:
JMETER_VERSION="5.6.3"
Then make the version part of your automation configuration.
This gives you reproducibility.
Why Version Pinning Matters
Avoid this kind of pipeline:
Install latest JMeter
        ↓
Run performance test
Because the test environment can change without the test code changing.
Prefer:
JMeter 5.6.3
Java version
Plugins
Test data
Configuration
        ↓
Repeatable performance test
Now, when results change, you have fewer unknown variables.
A Practical Upgrade Gate
You can create a simple automated gate around your JMeter upgrade.
For example:
Throughput >= 500 req/s
p95 <= 500 ms
Error rate <= 1%
Then your CI pipeline can evaluate the result.
Conceptually:
if [ "$THROUGHPUT" -lt 500 ]; then
    echo "Performance threshold failed"
    exit 1
fi
The exact implementation can vary, but the principle remains the same:
Performance tests should produce decisions, not just reports.
What Should You Validate Before Calling the Upgrade Safe?
Use a release-focused checklist:
| Validation | Priority |
|---|---|
| Test plan execution | High |
| Throughput timer behavior | High |
| Summary metrics | High |
| JDBC workloads | High |
| Startup diagnostics | Medium |
| Plugins | High |
| CI/CD integration | High |
| Distributed execution | High |
| Report generation | Medium |
| Java compatibility | High |
This gives you a much stronger upgrade process than simply checking whether the JMeter GUI launches.
The Bigger Lesson From Apache JMeter 5.6.3
The most valuable lesson from Apache JMeter 5.6.3 is not any single changelog item.
It is the reminder that a performance-testing tool is part of your measurement system.
When the measurement system changes, the measurements need validation.
That means treating a JMeter upgrade similarly to any other engineering dependency upgrade:
Dependency change
      ↓
Compatibility validation
      ↓
Baseline comparison
      ↓
Regression testing
      ↓
Automation validation
      ↓
Production confidence
If you skip those steps, you may still have a green pipeline.
But a green pipeline does not automatically mean trustworthy performance results.
Turning Apache JMeter 5.6.3 Into a Reliable Performance-Testing Workflow
The real value of Apache JMeter 5.6.3 appears when its capabilities are connected to a disciplined performance-engineering workflow. A load test should not end when JMeter produces a .jtl file. The useful question is what the result tells you about the system and whether that evidence is reliable enough to influence an engineering decision.
A practical workflow looks like this:
Test requirement
      ↓
Workload model
      ↓
JMeter test plan
      ↓
Controlled execution
      ↓
Metrics collection
      ↓
Threshold evaluation
      ↓
Engineering decision
This approach changes the role of the performance tester. Instead of becoming the person who simply “runs JMeter,” you become the person responsible for proving whether a system can satisfy measurable performance requirements.
Parameterize Workloads Instead of Duplicating Test Plans
One of the useful changes in Apache JMeter 5.6.3 is the ability to use variables for throughput settings in the relevant throughput timers.
That makes a single test plan more reusable.
For example, define a workload property:
TARGET_THROUGHPUT=600
Then pass it from the command line:
jmeter \
  -JTARGET_THROUGHPUT=600 \
  -n \
  -t checkout.jmx \
  -l checkout-results.jtl
Your CI pipeline can change the workload without modifying the JMX file.
Smoke       → 60 req/min
Baseline    → 300 req/min
Load        → 600 req/min
Stress      → 1,000 req/min
This is strategically better than maintaining:
checkout-smoke.jmx
checkout-load.jmx
checkout-stress.jmx
checkout-spike.jmx
because duplicated test plans eventually drift apart.
One plan with configurable workload parameters is easier to review, maintain, and version.


Treat Throughput as a Test Requirement
A common mistake is to define a performance test as:
“Run 500 virtual users.”
That is incomplete.
Virtual users and throughput are different concepts.
Consider:
500 users
+
5-second think time
+
3 requests per transaction
versus:
500 users
+
20-second think time
+
1 request per transaction
The two tests can generate dramatically different traffic.
A better performance requirement might be:
Concurrent users: 500
Target throughput: 600 requests/minute
p95 latency:       < 500 ms
Error rate:        < 1%
Now the test has measurable objectives.
This is where the throughput improvements in Apache JMeter 5.6.3 become particularly useful: workload configuration can become part of the environment rather than being hard-coded into multiple test plans.
Build Workload Profiles
A practical organization can store workload profiles as configuration.
# smoke.properties
TARGET_THROUGHPUT=60
USERS=10
DURATION=300
# baseline.properties
TARGET_THROUGHPUT=300
USERS=100
DURATION=900
# stress.properties
TARGET_THROUGHPUT=1000
USERS=500
DURATION=1200
Your execution script can select the profile.
PROFILE=${1:-baseline}

jmeter \
  -q "config/${PROFILE}.properties" \
  -n \
  -t scenarios/api.jmx \
  -l "results/${PROFILE}.jtl"
Now your performance-testing framework has a clear separation:
Scenario
    +
Configuration
    +
Environment
    =
Performance experiment
That separation is valuable when performance tests become part of engineering governance.
Don’t Confuse Load Testing With Capacity Testing
These terms are often mixed together.
| Test type | Primary question |
|---|---|
| Load test | Can the system handle expected workload? |
| Stress test | What happens beyond expected capacity? |
| Spike test | How does the system react to sudden traffic changes? |
| Soak test | Can it remain stable for a prolonged period? |
| Capacity test | Where is the practical maximum? |
| Scalability test | How does performance change as resources increase? |
A single JMeter scenario should not necessarily answer every question.
For example:
Baseline
600 req/min
30 minutes
may be suitable for a load test.
But a stress test might deliberately increase the workload:
600
800
1,000
1,200
1,500 req/min
until the system violates an agreed threshold.
The important point is to define the experiment before running the tool.
Make Performance Thresholds Explicit
A test report containing thousands of numbers is not automatically useful.
Your team should establish thresholds.
For example:
Throughput >= 600 req/min
p95 <= 500 ms
p99 <= 1,000 ms
Error rate <= 1%
Then the result becomes a decision:
PASS
or:
FAIL
You can also introduce severity levels:
GREEN  → Within target
AMBER  → Investigate
RED    → Release blocker
This makes performance testing much more actionable.
Validate the Metrics, Not Just the Requests
Suppose the application responds successfully to every request.
You might see:
HTTP 200: 100%
Errors:   0%
It is tempting to declare success.
But imagine:
Average: 180 ms
p95:     1.2 s
p99:     4.8 s
The application is technically responding, but many users may still experience unacceptable latency.
Performance analysis should therefore examine the distribution.
A useful report might contain:
Requests:       100,000
Errors:         0.4%
Throughput:     610 req/min
Average:        210 ms
Median:         160 ms
p90:            350 ms
p95:            480 ms
p99:            1,100 ms
The minimum value is useful too, which makes the Summary Report correction in Apache JMeter 5.6.3 relevant when validating reporting accuracy.
Why Minimum Response Time Is Not a Performance Target
Minimum latency tells you how quickly the fastest request completed.
It does not tell you what most users experienced.
Imagine:
Min:     20 ms
Average: 300 ms
p95:     900 ms
p99:     2,500 ms
The minimum looks excellent.
The system clearly has a tail-latency problem.
Therefore, never build a release decision around the minimum value alone.
A stronger hierarchy is:
Error rate
Throughput
p95
p99
Average
Median
Min/Max
The exact priority depends on the application’s SLA, but tail behavior deserves serious attention.
Use JDBC Tests Carefully
The JDBC-related improvement in Apache JMeter 5.6.3 also highlights an important performance-testing principle: control the amount of data involved in an experiment.
Suppose you test:
SELECT *
FROM transactions
WHERE customer_id = ?
If that query returns 50,000 records while your application only needs 100, you are measuring more than the intended application behavior.
If your scenario supports a maximum row constraint, use it deliberately.
For example:
Maximum rows: 100
The goal is not simply to make the query faster.
The goal is to make the test represent the intended user or application workload.
Database Performance Requires a Different Lens
When testing database-backed APIs, monitor both application and database behavior.
JMeter
   ↓
API
   ↓
Application Service
   ↓
Database
A slow response could originate from:
HTTP layer
Application code
Connection pool
SQL query
Database locks
Disk I/O
CPU
Network
JMeter tells you what the client experienced.
It does not automatically explain why the response was slow.
That is why mature performance testing combines JMeter with observability.
Combine JMeter With Observability
A useful architecture is:
                 ┌──────────────┐
                 │    JMeter    │
                 └──────┬───────┘
                        │
                        ▼
                 Application API
                        │
          ┌─────────────┼─────────────┐
          ▼             ▼             ▼
        Logs          Metrics        Traces
          │             │             │
          └─────────────┼─────────────┘
                        ▼
                 Performance analysis
This makes troubleshooting dramatically easier.
For example:
JMeter:
p95 = 1.8 seconds

Application:
CPU = 85%

Database:
Query latency = 1.4 seconds

Trace:
checkout query = 1.2 seconds
Now you have an investigation path.
Without observability, you only know that the request was slow.
Apache JMeter 5.6.3 vs k6 for CI/CD
The choice between JMeter and k6 should depend on your engineering environment.
| Requirement | JMeter | k6 |
|---|---|---|
| GUI-based test design | Strong | Limited |
| Code-first testing | Possible | Strong |
| Broad protocol support | Strong | More focused |
| Existing enterprise JMX assets | Excellent | Requires migration |
| JavaScript-based scenarios | Limited | Excellent |
| Developer familiarity | Moderate | Strong in JS teams |
| Large plugin ecosystem | Strong | Smaller |
| CI/CD integration | Strong | Strong |
| API-focused testing | Strong | Excellent |
| Legacy performance suites | Excellent | Migration required |
If your organization already has years of JMeter assets, replacing the platform should require a measurable business or engineering benefit.
A tool migration is itself an engineering project.
Apache JMeter 5.6.3 vs Gatling
Gatling emphasizes code-driven performance engineering.
A conceptual scenario might look like:
scenario("Checkout")
  .exec(http("Get checkout")
    .get("/checkout"))
  .pause(2)
  .exec(http("Submit order")
    .post("/orders"))
JMeter provides a different experience, with test plans represented through its GUI and JMX structure.
| Consideration | JMeter | Gatling |
|---|---|---|
| Visual test construction | Strong | Limited |
| Code review | Moderate | Strong |
| Non-HTTP protocols | Strong | More focused |
| Existing JMX ecosystem | Strong | Not applicable |
| Developer-oriented workflow | Moderate | Strong |
| Plugin ecosystem | Large | More controlled |
| Learning style | Visual | Code-oriented |
Neither approach is universally correct.
The right choice depends on the team maintaining the tests.
Don’t Upgrade a Performance Tool Directly Into Production Testing
A common anti-pattern looks like this:
New JMeter version
      ↓
Production-scale test
      ↓
Something looks different
      ↓
Investigate
Instead use progressive validation.
New version
    ↓
Local smoke test
    ↓
CI validation
    ↓
Small workload
    ↓
Baseline workload
    ↓
Stress workload
    ↓
Production readiness
This minimizes the blast radius of a tool upgrade.
Create a JMeter Upgrade Regression Suite
Your upgrade suite does not need hundreds of tests.
Start with representative scenarios.
upgrade-validation/
├── api-smoke.jmx
├── authentication.jmx
├── checkout.jmx
├── jdbc.jmx
├── throughput.jmx
└── distributed.jmx
Then validate:
✓ Test plans load
✓ Variables resolve
✓ Plugins initialize
✓ Throughput settings work
✓ HTTP requests execute
✓ JDBC requests execute
✓ Reports generate
✓ Results remain comparable
✓ CI/CD exit codes work
✓ Distributed execution works
This suite becomes a reusable safety net for future upgrades.


Compare Baselines Before and After the Upgrade
Never assume that a difference means the application changed.
Suppose the previous environment produced:
Throughput: 500 req/s
p95:        450 ms
p99:        850 ms
Errors:     0.3%
After the upgrade:
Throughput: 515 req/s
p95:        430 ms
p99:        820 ms
Errors:     0.3%
That looks positive.
But before concluding anything, repeat the same experiment multiple times.
Performance results contain natural variability.
A better comparison might be:
                    Old Version     New Version
Run 1 throughput       500              515
Run 2 throughput       508              510
Run 3 throughput       495              512

Average                501              512
Now you have stronger evidence.
Control the Environment
When comparing JMeter versions, keep as many variables constant as possible:
Same application build
Same database
Same dataset
Same infrastructure
Same JVM configuration
Same test data
Same workload
Same duration
Same network conditions
Only then does the comparison become meaningful.
This is essentially an experimental-design problem.
The tool version is your changing variable.
Everything else should remain as stable as practical.
Java Compatibility Matters
JMeter runs on Java, so your upgrade process must consider the JVM environment.
Record it as part of your test metadata:
java -version
For example, your performance artifact could contain:
JMeter: 5.6.3
Java:   <tested Java version>
OS:     Linux
Test:   checkout-baseline
Build:  application-build-id
This makes historical comparisons much easier.
When a result changes six months later, you can investigate the environment instead of guessing.
Make Test Results Reproducible
A mature performance repository should capture more than the .jmx file.
Consider storing:
performance/
├── scenarios/
├── config/
├── scripts/
├── datasets/
├── thresholds/
├── reports/
└── README.md
The README should document:
JMeter version
Java version
Execution command
Target environment
Workload profile
Expected thresholds
Dataset version
Result interpretation
Reproducibility is one of the strongest characteristics of an engineering-grade performance suite.
A Simple CI Performance Gate
You can turn your performance test into an automated release gate.
For example:
Requirement:
p95 < 500 ms
Error rate < 1%
Throughput >= 600 req/min
Your pipeline can evaluate those values and fail when requirements are violated.
Conceptually:
if [ "$P95" -gt 500 ]; then
    echo "p95 latency threshold exceeded"
    exit 1
fi

if [ "$ERROR_RATE" -gt 1 ]; then
    echo "Error threshold exceeded"
    exit 1
fi
The exact implementation can be adapted to your reporting stack.
The strategic objective is more important:
Turn performance measurements into automated engineering decisions.
Don’t Use Performance Testing as a One-Time Activity
A weak model is:
Before release
    ↓
Run load test
    ↓
Send PDF report
A stronger model is:
Every significant build
       ↓
Smoke performance test
       ↓
Scheduled baseline
       ↓
Periodic stress test
       ↓
Trend analysis
       ↓
Capacity planning
Now performance becomes part of continuous engineering.
You can identify gradual degradation before it becomes a production incident.
For example:
Week 1 → p95 320 ms
Week 2 → p95 350 ms
Week 3 → p95 390 ms
Week 4 → p95 470 ms
No individual result necessarily looks catastrophic.
The trend is the warning.
What Changed Strategically With Apache JMeter 5.6.3?
The release itself is primarily a maintenance release, but several changes support a broader engineering principle: make performance experiments more controlled and trustworthy.
The relevant improvements include:
- more flexible throughput configuration
- improved Summary Report minimum calculation
- better startup error logging
- improved JDBC row-limit behavior
- build and dependency maintenance
- continued modernization of the project internals
Not every changelog entry requires a change to your test strategy.
But every release should trigger a question:
Could this change alter how I generate, execute, or interpret performance-test results?
That is the right upgrade mindset.
When Should You Upgrade?
There is no universal answer.
A reasonable decision matrix is:
| Situation | Recommendation |
|---|---|
| Existing JMeter version works and environment is frozen | Plan upgrade carefully |
| You need throughput parameterization | Strong reason to evaluate |
| You depend heavily on JDBC testing | Validate the new release |
| CI startup diagnostics are problematic | Evaluate upgrade |
| Existing plugins are not compatible | Delay until validated |
| Production load testing is highly regulated | Perform formal regression first |
| New test environment is being created | Consider starting with the validated release |
Do not upgrade solely because a newer version exists.
Upgrade when the benefits, maintenance needs, compatibility requirements, or security considerations justify the change.
A Practical Apache JMeter 5.6.3 Upgrade Checklist
Before approving the release internally, verify:
[ ] JMeter version is explicitly pinned
[ ] Java version is documented
[ ] Existing JMX files execute successfully
[ ] Required plugins work
[ ] Variables resolve correctly
[ ] Throughput configuration behaves as expected
[ ] JDBC scenarios pass
[ ] Summary metrics are validated
[ ] Startup failures are observable
[ ] Reports are generated correctly
[ ] CI/CD execution works
[ ] Baseline results are available
[ ] New-version results are comparable
[ ] Performance thresholds still pass
[ ] Distributed execution is validated if used
Do not make the upgrade decision from a single successful test.
Use evidence from multiple representative workloads.
The Difference Between “It Runs” and “It Is Safe”
This distinction is critical.
A successful installation proves:
JMeter starts.
A successful upgrade validation proves much more:
JMeter starts
+
Tests execute
+
Workloads are correct
+
Metrics are trustworthy
+
Dependencies work
+
Automation works
+
Results remain comparable
That is the difference between installation validation and engineering validation.
Internal Links
- Learn MCP – Zero to Hero
- Learn AI Agents for QA – Zero to Hero
- Playwright Automation – Zero to Hero
- TencentDB Agent Memory: Complete Zero to Hero
- LangGraph: Complete Zero to Hero
- Learn Python – Zero to Hero
- OpenAI Codex: Complete Zero to Hero
- Cursor AI: Complete Zero to Hero
- Claude Code Tutorial: Complete Zero to Hero
- AutoGen: Complete Zero to Hero Guide
- Free QA Resources Built From Real Experience
- QA Glossary: Test Automation Terms Every Engineer Should Know
Official External Links
- Apache JMeter 5.6.3 release: Apache JMeter 5.6.3 GitHub Release
- Official JMeter changes: Apache JMeter 5.6.3 Changes
- Apache JMeter download: Apache JMeter Downloads
- Apache JMeter User Manual: Apache JMeter User Manual
- JMeter Getting Started: JMeter Getting Started Guide
- JMeter programmatic test plans: Building JMeter Test Plans Programmatically
People Asked Questions
What is Apache JMeter 5.6.3?
Apache JMeter 5.6.3 is a maintenance release in the JMeter 5.6.x line focused primarily on bug fixes, compatibility improvements and smaller usability enhancements.
What changed in Apache JMeter 5.6.3?
The release fixes issues involving Summary Report minimum response time, throughput timer variables, startup error logging, JDBC sampler row handling and binary API compatibility.
Should I upgrade to JMeter 5.6.3?
If you are already using the JMeter 5.6.x series, upgrading is generally attractive because 5.6.3 addresses regressions and correctness issues from earlier 5.6 releases. Existing test plans should still be validated in a controlled environment before production use.
Does JMeter 5.6.3 fix the Summary Report minimum response time issue?
Yes. The official changes document identifies the issue where JMeter 5.6 could show 0 as the minimum response time in the Summary Report and records the fix in 5.6.3.
Can JMeter throughput timers use variables in 5.6.3?
Yes. The 5.6.3 release includes support for variables in the ConstantThroughputTimer.throughput and PreciseThroughputTimer.throughput properties.
Does JMeter 5.6.3 change JDBC Sampler behavior?
The release passes JDBCSampler.maxRows to Statement.setMaxRows, helping control how many database rows the JDBC driver retrieves.
What Java version does JMeter 5.6.x require?
The official JMeter documentation states that JMeter 5.6.x requires Java 8 or later, with Java 17 or later recommended.
Where can I download JMeter 5.6.3?
The official Apache download page provides JMeter 5.6.3 binary and source archives and recommends verifying downloaded releases using signatures and checksums.
Is JMeter 5.6.3 suitable for CI/CD performance testing?
Yes. JMeter supports non-GUI execution and can be integrated into automated performance-testing pipelines. The key is to validate test plans, result thresholds, plugins and runtime dependencies after upgrading.
AI Overview / AI Search Optimization
Apache JMeter 5.6.3 is a bug-fix release that improves reporting accuracy, throughput-timer configuration, JDBC row handling and startup diagnostics. It also restores binary API compatibility affected by JMeter 5.6.2. For teams already using JMeter 5.6.x, the release is worth evaluating because it addresses several correctness and regression issues.
Conclusion
Apache JMeter 5.6.3 demonstrates why performance-testing tool upgrades deserve the same engineering discipline as application dependency upgrades.
The most useful changes are not necessarily the largest changelog entries. Throughput configuration improvements can make workload profiles easier to parameterize. Reporting fixes can improve confidence in metrics. Better startup diagnostics can make CI failures easier to investigate. JDBC improvements can provide tighter control over database workloads.
But the biggest lesson is broader.
A performance test is an experiment.
The workload is your input. JMeter is part of your measurement system. The application is the system under test. Metrics are your evidence. Thresholds are your decision criteria.
If any part of that chain changes, validate it.
A strong upgrade strategy therefore looks like:
Baseline
   ↓
Upgrade
   ↓
Smoke validation
   ↓
Workload validation
   ↓
Metric validation
   ↓
CI/CD validation
   ↓
Controlled comparison
   ↓
Production approval
That approach gives your team something more valuable than a newer testing tool: confidence that your performance results still mean what you think they mean.
Final Key Takeaways
- Apache JMeter 5.6.3 should be evaluated as a measurement-system upgrade, not merely a software installation.
- Throughput parameterization makes it easier to maintain one test plan across smoke, baseline, load, and stress workloads.
- Performance tests should define measurable targets such as throughput, p95, p99, and error rate rather than relying only on average response time.
- The Summary Report correction reinforces the importance of validating the metrics produced by your performance-testing infrastructure.
- JDBC workloads should deliberately control returned data so that the test represents the intended scenario.
- Better startup diagnostics are particularly valuable when JMeter runs inside CI/CD pipelines.
- JMeter should not automatically be replaced by k6 or Gatling simply because those tools use a different testing model. Tool selection should follow team requirements and existing assets.
- Always establish a baseline before comparing performance results between JMeter versions.
- Keep the application, infrastructure, test data, workload, JVM, and other important variables controlled when evaluating an upgrade.
- Pin the JMeter version in CI/CD rather than silently using whatever version happens to be available.
- Build a small upgrade-regression suite covering representative HTTP, JDBC, throughput, reporting, plugin, and distributed-testing scenarios.
- The strongest performance-testing strategy is not “Can JMeter run the test?” It is “Can we trust the evidence produced by the test?”
That is the mindset that turns performance testing from a reporting activity into an engineering discipline.
Continue Learning
Explore more expert articles on Mobile Testing, Backend & API, AI & Agentic, AI Tools, n8n, LangChain, CrewAI, MCP Servers, AI Agents, LlamaIndex, Docker, FastAPI, Playwright, Cypress, Test Automation, DevOps, and Software Engineering at www.skakarh.com.
QAPulse by SK delivers expert release analysis, AI engineering insights, enterprise automation strategies, migration guidance, DevOps best practices, and practical testing knowledge to help software professionals build scalable, intelligent, and production-ready software systems.