 QA
QA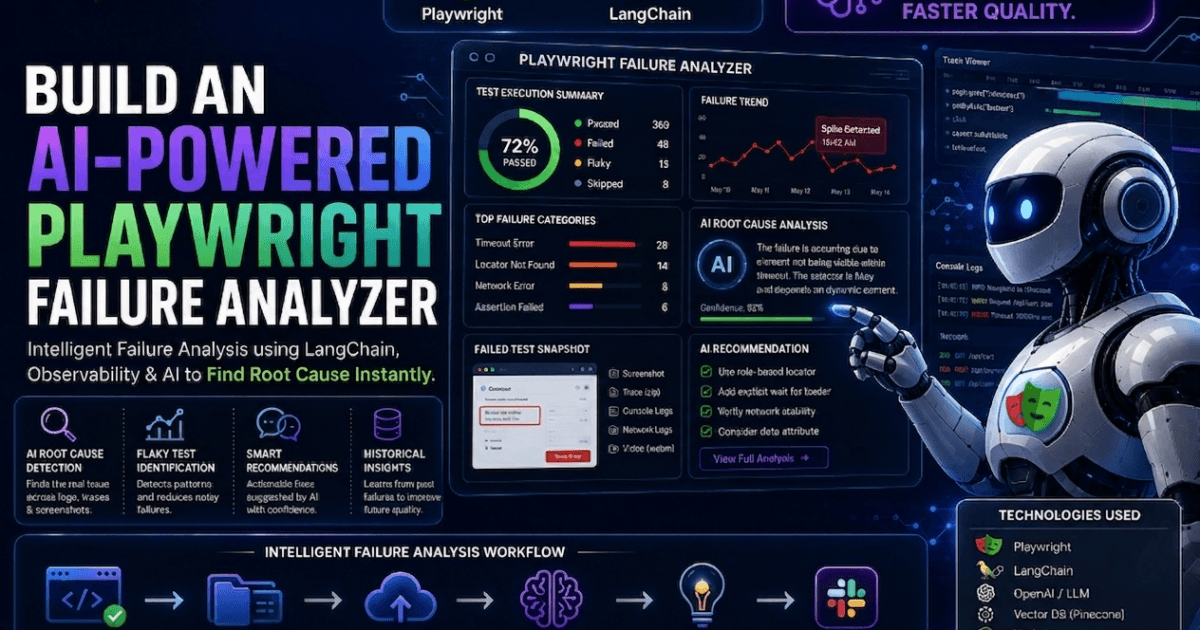
Playwright Failure Analyzer Systems Are Becoming Essential in Modern QA
Modern automation systems generate massive amounts of:
- screenshots
- stack traces
- network logs
- videos
- traces
- console logs
- CI/CD telemetry
But most teams still debug failures manually.
A failed test usually means:
an engineer opens logs and starts detective work
That workflow does not scale anymore.
As regression suites become larger and CI/CD pipelines become more distributed, debugging itself becomes one of the biggest engineering bottlenecks in modern QA.
This is exactly why the idea of a modern Playwright failure analyzer is becoming extremely valuable in 2026.
Instead of simply reporting failures, intelligent systems increasingly:
- classify incidents
- detect flaky patterns
- summarize root causes
- identify infrastructure issues
- correlate logs and traces
- recommend debugging actions
Modern QA engineering is slowly shifting from:
test execution
toward:
failure intelligenceWhy Traditional Automation Debugging Is Breaking Down
Most teams underestimate how expensive debugging actually becomes at scale.
As automation systems grow:
- flaky tests increase
- execution noise increases
- debugging fatigue increases
- CI instability increases
Eventually engineers spend enormous time trying to understand:
- why a locator failed
- whether an API was unstable
- if an environment issue occurred
- whether the problem is flaky or real
This creates hidden operational overhead.
Because automation systems that are difficult to debug eventually become:
low-trust engineering systems
And once engineers stop trusting automation:
the entire value of automated testing weakens.
That is why modern QA systems increasingly need:
👉 intelligent debugging pipelines
not simply:
👉 larger regression suites
What a Modern Playwright Failure Analyzer Should Actually Do
A strong Playwright failure analyzer should go far beyond:
- parsing stack traces
- sending Slack alerts
- storing screenshots
Modern systems increasingly need to:
- inspect screenshots
- analyze traces
- classify failures
- detect flaky behavior
- inspect console logs
- correlate network failures
- summarize probable causes
- identify environment instability
The real goal is not:
replace QA engineers
The goal is:
reduce debugging friction dramatically
That difference matters massively.
Why Playwright Is Perfect for Intelligent Failure Analysis
Playwright already provides rich debugging artifacts:
- trace viewer
- screenshots
- network inspection
- videos
- execution metadata
- browser-level visibility
This makes Playwright one of the strongest foundations for building AI-assisted debugging systems.
Unlike older automation ecosystems that expose limited runtime visibility, Playwright provides:
high-quality observability signals
And observability is the foundation of intelligent debugging.
This is one reason many modern AI-native automation systems increasingly choose Playwright as:
- the execution layer
- the browser orchestration layer
- the telemetry collection layer
Why LangChain Fits Naturally Into a Playwright Failure Analyzer
LangChain is becoming popular because it helps engineers build:
- AI workflows
- retrieval systems
- reasoning pipelines
- orchestration systems
- memory-driven applications
For a Playwright failure analyzer, LangChain becomes useful for:
- summarizing failures
- analyzing logs
- correlating incidents
- retrieving historical failures
- classifying flaky patterns
- generating debugging recommendations
Instead of engineers manually reviewing:
thousands of raw execution logs
LangChain can help transform debugging into:
structured engineering intelligenceHigh-Level Architecture of the Playwright Failure Analyzer
A scalable Playwright failure analyzer typically contains multiple intelligent layers.
Layer 1 — Playwright Execution Layer
This layer handles:
- browser execution
- screenshots
- traces
- network logs
- console logs
- videos
Example Playwright configuration:
import { defineConfig } from '@playwright/test';

export default defineConfig({
  use: {
    screenshot: 'only-on-failure',
    video: 'retain-on-failure',
    trace: 'retain-on-failure'
  }
});
This alone dramatically improves debugging visibility.
Layer 2 — Failure Artifact Collector
After failures occur, the system collects:
- traces
- screenshots
- logs
- execution metadata
Example artifact collector:
import fs from 'fs';

function collectFailureArtifacts(testInfo) {
  return {
    title: testInfo.title,
    status: testInfo.status,
    screenshot: testInfo.outputPath('failure.png'),
    trace: testInfo.outputPath('trace.zip'),
    logs: fs.readFileSync('logs.txt', 'utf8')
  };
}
This creates structured debugging input for the AI layer.
Layer 3 — LangChain Intelligence Pipeline
This is where intelligent reasoning begins.
Example LangChain integration:
import { ChatOpenAI } from '@langchain/openai';

const model = new ChatOpenAI({
  modelName: 'gpt-4.1',
  temperature: 0
});
Now we can create intelligent prompts.
Example Failure Analysis Prompt
const prompt = `
You are an expert QA debugging assistant.

Analyze the following Playwright failure.

Logs:
${logs}

Return:
1. Root cause
2. Failure category
3. Suggested fix
4. Flaky probability
`;
This transforms raw execution data into structured debugging analysis.
Example AI Failure Summary
Instead of returning:
Timeout 30000ms exceeded
the AI system may generate:
The failure likely occurred due to delayed API rendering after deployment rollout. Similar failures appeared in 12 previous executions involving async UI hydration delays.
That creates dramatically better debugging context.
Building a Failure Classification Engine
A modern Playwright failure analyzer should classify failures automatically.
Example categories:
- flaky synchronization
- API outage
- authentication issue
- infrastructure instability
- environment configuration problem
- locator instability
- browser crash
- test data inconsistency
Example classifier:
function classifyFailure(logs) {
  if (logs.includes('Timeout')) {
    return 'Synchronization Issue';
  }

  if (logs.includes('401')) {
    return 'Authentication Failure';
  }

  if (logs.includes('ECONNREFUSED')) {
    return 'Environment Instability';
  }

  return 'Unknown Failure';
}
This helps teams prioritize debugging efficiently.
Detecting Flaky Patterns Using Historical Failures
One of the biggest opportunities in intelligent QA systems is:
flaky pattern detection
Most flaky tests repeat similar signals over time.
Modern systems increasingly compare:
- screenshots
- logs
- execution timing
- network instability
- retry patterns
to detect:
- recurring instability
- intermittent failures
- infrastructure bottlenecks
Example simple flaky detection logic:
function detectFlaky(history) {
  const failures = history.filter(t => t.status === 'failed');

  return failures.length > 3;
}
Real enterprise systems use much more advanced telemetry correlation.
But even basic pattern analysis dramatically improves debugging efficiency.
Integrating Vector Search for Historical Failure Retrieval
Modern AI debugging systems increasingly use:
- embeddings
- vector databases
- semantic retrieval
This allows systems to retrieve:
similar historical incidents
before generating recommendations.
Example workflow:
- current failure gets embedded
- vector search retrieves similar incidents
- LangChain analyzes prior resolutions
- AI generates smarter debugging recommendations
This creates:
👉 contextual debugging intelligence
instead of isolated incident analysis.
Why Observability Matters More Than AI Prompts
Most teams think AI quality mainly depends on:
- better prompts
- larger models
- smarter agents
But honestly?
AI debugging systems fail primarily because:
they lack strong observability
Without:
- traces
- telemetry
- execution visibility
- runtime diagnostics
AI systems become weak at reasoning.
Modern Playwright failure analyzer systems increasingly depend on:
- telemetry pipelines
- distributed tracing
- structured logging
- execution graphs
- runtime events
Because debugging intelligence requires:
👉 high-quality runtime signals
Example End-to-End Playwright Failure Analyzer Flow
A modern workflow may look like this:
Step 1 — Test Execution
Playwright executes:
- UI automation
- API validation
- browser interactions
Step 2 — Failure Occurs
Artifacts generated:
- screenshots
- trace files
- console logs
- network logs
Step 3 — Artifact Upload Pipeline
Artifacts get uploaded to:
- S3
- observability platforms
- telemetry systems
- vector databases
Step 4 — LangChain Processing
LangChain:
- summarizes failures
- classifies issues
- retrieves historical incidents
- generates debugging recommendations
Step 5 — Intelligent Incident Report Generated
Engineers receive:
- probable root cause
- flaky probability
- suggested fixes
- related incidents
- infrastructure signals
Instead of manually reading raw logs for hours.
Why AI-Powered Debugging Will Become Standard in QA
Modern engineering systems are becoming:
- larger
- faster
- more distributed
- increasingly AI-native
Manual debugging simply cannot scale forever.
That’s why modern QA increasingly moves toward:
- intelligent debugging
- adaptive automation
- observability-first pipelines
- AI-assisted orchestration
The strongest engineering teams are already investing heavily in:
- telemetry systems
- execution intelligence
- flaky detection
- AI-native debugging workflows
Because debugging speed increasingly becomes:
a competitive engineering advantageWhy the Playwright Failure Analyzer Is Becoming a Critical QA System
The modern Playwright failure analyzer is becoming far more than a debugging utility. In 2026, intelligent QA systems increasingly combine Playwright observability, LangChain orchestration, telemetry pipelines, structured logging, vector retrieval, and AI-assisted reasoning to reduce debugging overhead dramatically. As automation ecosystems become larger and more distributed, intelligent failure analysis systems help engineering teams classify incidents, detect flaky patterns, prioritize failures, and improve automation trust at enterprise scale.
More Related Blogs
- Learn MCP – Zero to Hero
- Learn AI Agents for QA – Zero to Hero
- Playwright Automation – Zero to Hero
- TencentDB Agent Memory: Complete Zero to Hero
- LangGraph: Complete Zero to Hero
- Learn Python – Zero to Hero
- OpenAI Codex: Complete Zero to Hero
- Cursor AI: Complete Zero to Hero
- Claude Code Tutorial: Complete Zero to Hero
- AutoGen: Complete Zero to Hero Guide
- Free QA Resources Built From Real Experience
- QA Glossary: Test Automation Terms Every Engineer Should Know
External Resources
Final Thoughts
The future of QA is not simply:
running more tests
The future is:
understanding failures intelligently
Because eventually:
the teams that debug fastest will often ship fastest.
And intelligent failure analysis systems will increasingly become one of the most valuable parts of modern QA engineering ecosystems.