 QA
QA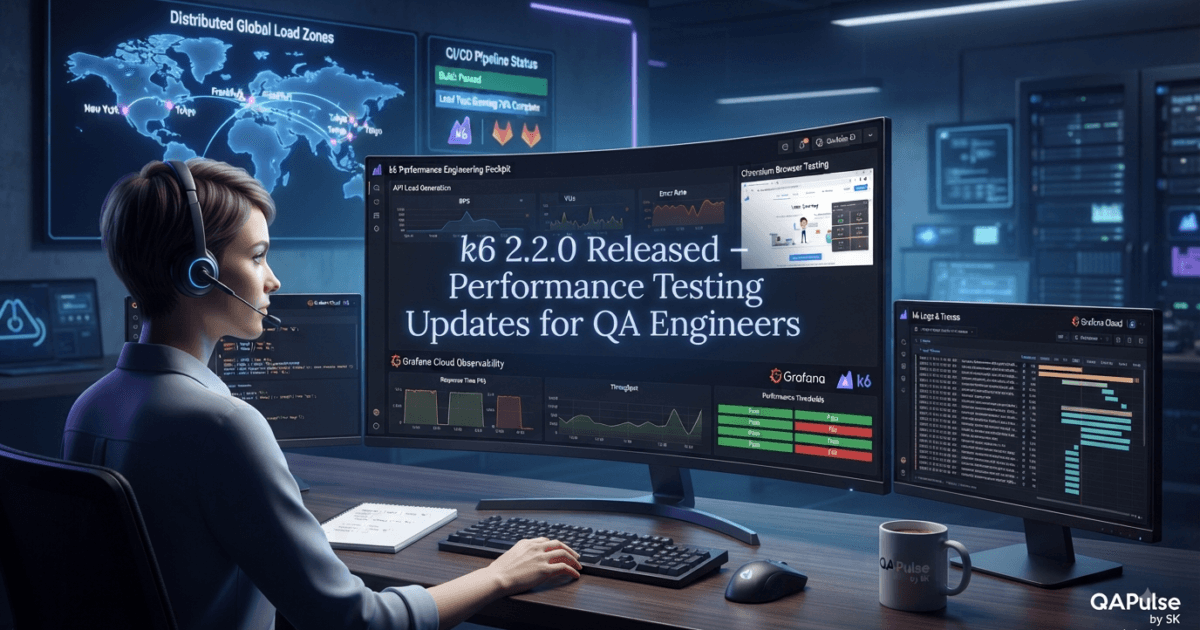
k6 2.2.0 Released on August 10, 2026, bringing a focused set of improvements for performance engineers, QA engineers, SDETs, and teams running browser and load tests as part of modern CI/CD pipelines. The release adds better Grafana Cloud visibility for local execution, introduces chromium.connectOverCDP(), expands web-platform APIs, adds a load-zone discovery command, and introduces experimental feature flags. Grafana’s release planning confirms the August 10 release date, while its versioning policy states that k6 follows semantic versioning and that minor releases add backward-compatible functionality. (GitHub)
For QA engineers, however, the important question is not simply what was added to k6 2.2.0.
The more useful question is:
How do these changes affect the way we design, execute, observe, and troubleshoot performance tests?
That distinction matters.
A release note gives you features.
A QA engineer needs to understand the engineering impact behind those features.
What’s New in k6 2.2.0?
The most important additions in k6 2.2.0 include:
| Change | What It Does | Why QA Engineers Should Care |
|---|---|---|
| Local execution cloud logs | Streams logs from k6 cloud run --local-execution to Grafana Cloud | Better centralized troubleshooting |
chromium.connectOverCDP() | Connects to an already-running Chromium instance | More flexible browser testing |
TextEncoder / TextDecoder | Makes these APIs available globally | Better compatibility with JavaScript tooling |
WritableStream | Adds support in k6/experimental/streams | Enables additional streaming scenarios |
k6 cloud load-zone list | Lists available cloud load zones | Easier test-location planning |
merge-run-tags | Experimental feature flag | More control over run metadata |
freeze-env | Experimental feature flag | More controlled environment behavior |
| Breaking changes | None reported for this release | Lower migration risk |
The release therefore isn’t about one giant feature.
It is about making the k6 performance-testing ecosystem more flexible and observable.
That is particularly relevant because performance testing is moving beyond the traditional model of:
Write Script
     ↓
Generate Load
     ↓
Collect Metrics
     ↓
Stop Test
Modern performance engineering looks more like:
Test Design
     ↓
Load Generation
     ↓
Browser/API Execution
     ↓
Distributed Infrastructure
     ↓
Observability
     ↓
Cloud Analysis
     ↓
Engineering Decision
That broader workflow is where the value of k6 2.2.0 becomes easier to understand.
Why k6 2.2.0 Matters to QA Engineers
A performance test is only useful if engineers can trust its results and investigate problems efficiently.
Imagine this scenario.
Your team runs a load test locally:
k6 cloud run --local-execution script.js
The test executes on the local machine, but the team uses Grafana Cloud to analyze test results.
Before the new behavior, local execution logs could remain on the machine running k6 rather than appearing in the cloud run’s log view.
With k6 2.2.0, those logs can now stream to the Grafana Cloud test run. Grafana also provides a --no-cloud-logs option when teams intentionally do not want local-execution logs streamed. (GitHub)
That changes the troubleshooting workflow:
Before

Local k6
   ↓
Test Execution
   ↓
Logs stay local
   ↓
Engineer investigates locally


With k6 2.2.0

Local k6
   ↓
Test Execution
   ↓
Logs
   ↓
Grafana Cloud
   ↓
Centralized Test Run
   ↓
Team Investigation
This may sound like a small operational improvement.
For distributed QA teams, it can be much more significant.
Local Execution Does Not Have to Mean Local Visibility
This is an important concept for SDETs.
There are two different questions:
Where does the test execute?
and
Where can the team observe the test?
Those are not necessarily the same thing.
A test can execute locally while its results and logs are available centrally.
Execution Location
        ≠
Observation Location
This separation is valuable in modern performance engineering.
Consider a team where:
- the SDET runs tests from a CI worker,
- the performance engineer monitors Grafana Cloud,
- the developer investigates application behavior,
- the DevOps engineer watches infrastructure metrics.
Centralized visibility allows everyone to work from the same test run.


A Practical k6 2.2.0 Example
A simple k6 performance test can look like this:
import http from 'k6/http';
import { check, sleep } from 'k6';

export const options = {
  vus: 10,
  duration: '30s',
  thresholds: {
    http_req_failed: ['rate<0.01'],
    http_req_duration: ['p(95)<500']
  }
};

export default function () {
  const response = http.get('https://example.test/api/products');

  check(response, {
    'status is 200': (r) => r.status === 200
  });

  sleep(1);
}
Then execute locally:
k6 run script.js
Or use local execution with the cloud workflow:
k6 cloud run --local-execution script.js
If you want to prevent cloud log streaming during local execution, k6 2.2.0 provides:
k6 cloud run --local-execution --no-cloud-logs script.js
The important lesson is not memorizing these commands.
It is understanding the separation between:
Load Generation
+
Test Execution
+
Test Observability
A mature performance-testing strategy treats all three as first-class concerns.
chromium.connectOverCDP() Changes Browser Test Flexibility
Another important capability in k6 2.2.0 is:
chromium.connectOverCDP()
The function allows browser-oriented tests to connect to an already-running Chromium instance.
This creates a different model from launching a browser entirely inside the test.
Conceptually:
Traditional Model

k6
 ↓
Launch Browser
 ↓
Create Context
 ↓
Run Test
With CDP connectivity:
Existing Chromium
       ↑
       │
CDP Connection
       │
       ↓
      k6
       ↓
    Test Flow
This can be useful when the browser lifecycle is controlled externally.
For example, your infrastructure may already manage Chromium for:
- containerized testing,
- debugging,
- specialized browser environments,
- shared test infrastructure,
- custom browser startup configurations.
The k6 release makes that integration model more accessible.
Why Browser Connectivity Matters for Performance Engineers
Performance testing is no longer limited to HTTP request generation.
Modern applications often require browser-level validation.
Think about a customer journey:
Open Application
      ↓
Authenticate
      ↓
Load Dashboard
      ↓
Fetch APIs
      ↓
Render Components
      ↓
Interact With UI
A pure HTTP test may measure backend performance extremely well.
But it may not tell you what the browser experiences.
Browser performance testing adds another layer:
Backend Performance
        +
Browser Performance
        +
User Journey
That is where browser capabilities in k6 become strategically interesting.
k6 vs Traditional Load Testing Tools
Consider how different tools approach performance testing.
| Capability | k6 | JMeter | Locust |
|---|---|---|---|
| Script language | JavaScript/TypeScript ecosystem | GUI/XML + Java ecosystem | Python |
| CLI-first workflow | Strong | Available | Strong |
| Git-friendly tests | Strong | Strong | Strong |
| CI/CD integration | Strong | Strong | Strong |
| Cloud integration | Grafana ecosystem | Depends on platform | Depends on platform |
| Browser testing | Available | More specialized | Available through integrations/tools |
| Observability ecosystem | Strong with Grafana | Broad integrations | Broad integrations |
| Developer experience | Code-centric | GUI-centric | Python-centric |
The strategic point is not that k6 replaces every other tool.
It is that k6 fits particularly well into a code-first performance engineering workflow.
For teams already using JavaScript/TypeScript, Git, CI/CD, and Grafana, that alignment can reduce friction.
Think Beyond Load Generation
A common beginner definition is:
“k6 is a load-testing tool.”
That is true, but incomplete.
A stronger definition is:
k6 is a programmable performance-testing platform that can connect load generation, browser testing, CI/CD, cloud execution, and observability into an engineering workflow.
That broader definition helps explain why features such as cloud logs, browser connectivity, and load-zone discovery matter.
The value is in the ecosystem around the test.
New Load-Zone Discovery
k6 2.2.0 also introduces:
k6 cloud load-zone list
At first glance, this looks like a simple CLI convenience.
For performance engineers, it has a deeper purpose.
Where you generate traffic from matters.
Suppose your users are distributed across:
North America
Europe
Asia-Pacific
A test generated from only one geographic location may not represent real-world network behavior.
Your architecture could look like:
                 Application
                     ↑
        ┌────────────┼────────────┐
        │            │            │
   Load Zone A   Load Zone B   Load Zone C
        │            │            │
      Users        Users        Users
This allows teams to think about geographic load as part of test design.
The question changes from:
“Can the API handle 10,000 requests?”
to:
“Can the API handle realistic traffic distributed across the regions where our users actually exist?”
That is a much better performance-engineering question.
Make Load Location Part of Test Strategy
Before selecting a load zone, ask:
Where are our users?
Where is our infrastructure?
Where are our critical services?
Where are latency-sensitive operations?
Where are CDN edges located?
Then design the test accordingly.
For example:
export const options = {
  scenarios: {
    api_load: {
      executor: 'constant-vus',
      vus: 100,
      duration: '5m'
    }
  }
};
The script defines the workload.
The infrastructure defines where that workload originates.
Both matter.
Experimental Features Need Different Thinking
k6 2.2.0 also introduces experimental feature flags including:
merge-run-tags
freeze-env
This is where QA engineers should apply risk-based thinking.
An experimental feature should not automatically become part of a critical production performance suite.
Use this model:
Experimental
     ↓
Proof of Concept
     ↓
Controlled Test
     ↓
Measure
     ↓
Evaluate
     ↓
Production Adoption
Do not skip directly from:
Experimental
     ↓
Production
unless the risk is well understood.
What Does “No Breaking Changes” Mean?
The release notes indicate no breaking changes for k6 2.2.0.
That is good news for existing users.
But “no breaking changes” does not mean:
“No testing required.”
There is still a difference between:
API Compatibility
and:
Environment Compatibility
Your test may remain syntactically valid while your:
- CI image,
- browser setup,
- secrets,
- cloud configuration,
- thresholds,
- extensions,
- dashboards,
- test orchestration
behave differently.
Grafana’s versioning documentation describes minor releases as backward-compatible API additions or changes, while its stability guarantees apply to explicitly covered APIs. (Grafana Labs)
So the practical QA rule remains:
No breaking changes means lower migration risk, not zero validation risk.
Should QA Teams Upgrade Immediately?
For most teams, the answer should be:
Evaluate quickly, adopt deliberately.
The release contains useful capabilities, especially for teams using:
- Grafana Cloud k6,
- local cloud execution,
- browser-based performance tests,
- Chromium infrastructure,
- geographically distributed load testing,
- CI/CD performance gates.
If your team does not use those areas, the immediate business value may be smaller.
A strategic decision matrix helps:
| Your Environment | Upgrade Priority |
|---|---|
| Heavy Grafana Cloud usage | High |
| Local execution + Cloud analysis | High |
| Browser performance testing | High |
| Remote Chromium infrastructure | High |
| Multi-region load testing | Medium-High |
| Basic API load testing only | Medium |
| Stable legacy performance suite | Controlled evaluation |
| Experimental features required | Evaluate carefully |
This prevents teams from treating every release as equally urgent.
The First Upgrade Check
Before changing your performance-testing environment, capture the current version:
k6 version
Then record your baseline:
k6 version:
Test duration:
Virtual users:
Request rate:
p95 latency:
p99 latency:
Error rate:
Threshold failures:
Cloud reporting:
Browser tests:
After installing the new version, repeat the same workload.
For example:
Before
p95: 420 ms
p99: 710 ms
Errors: 0.4%

After
p95: 415 ms
p99: 690 ms
Errors: 0.3%
Do not conclude that the new version is automatically faster.
Performance results contain natural variation.
Run enough repetitions to distinguish signal from noise.
That is one of the most important habits in performance engineering.
Upgrade Performance Tools Like Production Infrastructure
A performance-testing framework is itself part of your engineering infrastructure.
Treat upgrades with the same discipline you would apply to:
CI Runner
Browser
Node.js
Docker Image
Monitoring Agent
Test Framework
The workflow should be:
Current Version
      ↓
Baseline
      ↓
Upgrade Candidate
      ↓
Smoke Test
      ↓
Performance Validation
      ↓
CI Validation
      ↓
Cloud Validation
      ↓
Team Approval
This approach makes performance testing more trustworthy.
And trust is ultimately what QA engineering is trying to create.
Designing Better Performance Tests with k6 2.2.0
k6 2.2.0 Released with several changes that become particularly interesting when performance testing is treated as an engineering discipline rather than a one-time load exercise. The practical opportunity is to connect workload generation, browser behavior, observability, geographic load distribution, and CI/CD validation into one repeatable strategy.
The first step is understanding that a performance script is not the test itself.
The script is only the workload definition.
A complete performance test includes:
Workload
   ↓
Execution Environment
   ↓
Load Distribution
   ↓
Application
   ↓
Infrastructure
   ↓
Telemetry
   ↓
Analysis
   ↓
Engineering Decision
If one of these layers is poorly designed, impressive-looking performance numbers can still lead to the wrong conclusion.
Use Thresholds as Engineering Contracts
A good k6 test should define what “acceptable performance” means before execution.
For example:
import http from 'k6/http';
import { check } from 'k6';

export const options = {
  vus: 50,
  duration: '2m',

  thresholds: {
    http_req_duration: ['p(95)<500'],
    http_req_failed: ['rate<0.01']
  }
};

export default function () {
  const response = http.get('https://example.test/api/products');

  check(response, {
    'response is successful': (r) => r.status === 200
  });
}
The important part is not the syntax.
It is the contract:
95% of requests
       ↓
must complete below
       ↓
500 ms
And:
HTTP failure rate
       ↓
must remain below
       ↓
1%
This changes performance testing from:
“Let’s generate traffic and look at the graph.”
to:
“Let’s determine whether the system satisfies a measurable performance requirement.”
That is a major maturity improvement.
Separate Load From Performance Requirements
These concepts are often mixed together.
Load describes what you generate.
Performance describes how the system responds.
For example:
Load:
500 virtual users

Performance:
p95 < 500 ms
error rate < 1%
A useful test therefore has both dimensions:
| Dimension | Example |
|---|---|
| Virtual users | 500 |
| Request rate | 2,000 req/s |
| Duration | 10 minutes |
| p95 threshold | < 500 ms |
| p99 threshold | < 1 second |
| Error threshold | < 1% |
If you increase virtual users without defining acceptable latency, you are measuring load capacity but not necessarily meeting a business performance objective.
Design Workloads Around User Behavior
A common mistake is creating an unrealistic workload:
GET /
GET /
GET /
GET /
GET /
Real applications rarely behave that way.
A more realistic scenario might be:
Login
  ↓
Search
  ↓
Open Product
  ↓
Add to Cart
  ↓
Checkout
  ↓
Payment
Represent that behavior in the performance model.
export default function () {
  const login = http.post(
    'https://example.test/api/login',
    JSON.stringify({
      username: 'performance-user',
      password: 'secret'
    }),
    {
      headers: {
        'Content-Type': 'application/json'
      }
    }
  );

  check(login, {
    'login successful': (r) => r.status === 200
  });

  const products = http.get(
    'https://example.test/api/products'
  );

  check(products, {
    'products loaded': (r) => r.status === 200
  });
}
The exact implementation depends on your application, but the strategy is universal:
Model the workload that users create, not the requests that are easiest to script.
Think About Correlation
Realistic performance tests often require dynamic data.
Suppose the login response returns a token.
Do not hard-code the same token into every virtual user.
Instead:
const loginResponse = http.post(
  'https://example.test/api/login',
  JSON.stringify(credentials),
  {
    headers: {
      'Content-Type': 'application/json'
    }
  }
);

const token = loginResponse.json('token');

const response = http.get(
  'https://example.test/api/orders',
  {
    headers: {
      Authorization: `Bearer ${token}`
    }
  }
);
This produces a more realistic workload.
Without correlation:
1 Token
 ↓
Every Virtual User
 ↓
Unrealistic Traffic
With correlation:
Virtual User
 ↓
Authentication
 ↓
Unique Token
 ↓
Authenticated Requests
Performance tests should reproduce application behavior as closely as practical.
Use Data Variation to Avoid False Confidence
Suppose every virtual user searches for:
"laptop"
Your caching layer may become unusually effective.
Then your test reports:
p95 = 120 ms
But production users search for thousands of different values.
Introduce realistic variation.
const searchTerms = [
  'laptop',
  'monitor',
  'keyboard',
  'headphones',
  'tablet'
];

const term =
  searchTerms[Math.floor(Math.random() * searchTerms.length)];

http.get(
  `https://example.test/api/search?q=${encodeURIComponent(term)}`
);
The goal is not randomness for its own sake.
The goal is representative workload diversity.
Browser Testing Adds Another Dimension
The browser capability in k6 2.2.0 makes browser-oriented performance scenarios particularly interesting for teams already using k6 for API and load testing.
A browser journey might look like:
import { browser } from 'k6/browser';

export const options = {
  scenarios: {
    browser_test: {
      executor: 'constant-vus',
      vus: 2,
      duration: '1m',
      options: {
        browser: {
          type: 'chromium'
        }
      }
    }
  }
};

export default async function () {
  const page = await browser.newPage();

  try {
    await page.goto('https://example.test');

    await page.locator('[data-testid="login"]').click();
  } finally {
    await page.close();
  }
}
Browser testing should not automatically replace API load testing.
The two approaches answer different questions.
API Load Test
     ↓
Backend Capacity
     ↓
Request Latency
     ↓
Service Reliability
versus:
Browser Test
     ↓
Real User Journey
     ↓
Browser Interaction
     ↓
Frontend Experience
The strongest strategy is often to use both at appropriate levels.


Don’t Generate Millions of Browser Users
This is a critical performance-engineering distinction.
Browser execution is substantially more resource-intensive than lightweight HTTP traffic.
Therefore, a realistic architecture might be:
                  Performance Test
                        │
             ┌──────────┴──────────┐
             ↓                     ↓
        API Load               Browser Load
        10,000 VUs                20 VUs
             │                     │
             └──────────┬──────────┘
                        ↓
                   Application
The API layer can model massive backend demand.
A smaller browser population can model realistic user journeys.
This is usually more meaningful than trying to simulate every virtual user through a full browser.
Compare k6 With Browser-Focused Automation
QA engineers sometimes ask why they should not simply use an existing browser automation framework for performance testing.
Consider the difference:
| Tool/Approach | Primary Strength | Performance Role |
|---|---|---|
| k6 | Load + performance engineering | Primary performance platform |
| Playwright | Browser automation | Excellent functional/browser testing |
| Cypress | Developer-friendly web testing | Primarily functional/e2e |
| Selenium | Broad browser automation ecosystem | Primarily functional automation |
| JMeter | Mature load testing | Strong protocol/load testing |
A browser automation framework can prove that a user journey works.
A performance platform must additionally answer:
How does the system behave when thousands of users create demand?
That distinction is fundamental.
Use chromium.connectOverCDP() Strategically
Connecting to an already-running Chromium instance can be useful when browser lifecycle management is handled outside the k6 test itself.
Conceptually:
Browser Infrastructure
        ↓
Running Chromium
        ↓
CDP
        ↓
k6 Browser Test
        ↓
Application
This can become useful in environments where Chromium startup needs to be controlled by:
- containers,
- CI infrastructure,
- debugging environments,
- custom launch parameters,
- external orchestration.
The strategic advantage is flexibility.
Instead of forcing every test to own the entire browser lifecycle, your architecture can separate:
Browser Lifecycle
        +
Test Lifecycle
That separation can simplify specialized performance environments.
But Don’t Introduce CDP Without a Reason
A new capability does not automatically justify architectural complexity.
Ask:
Do we need external browser lifecycle control?
        ↓
Yes → Evaluate CDP integration
        ↓
No → Keep the simpler browser model
This is a recurring principle in test automation:
Use advanced capabilities to solve real constraints, not because they exist.
Simplicity is an engineering feature.
Centralized Logs Improve Incident Investigation
The local-execution cloud logging capability in k6 2.2.0 also changes how teams can troubleshoot distributed performance runs.
Imagine a CI test produces:
Threshold failed
p95 > 500 ms
The metric tells you what happened.
Logs may help explain why.
A mature investigation combines:
k6 Metrics
+
k6 Logs
+
Application Logs
+
Infrastructure Metrics
+
Tracing
Then the analysis becomes:
Performance Regression
        ↓
k6 detects latency increase
        ↓
Application metrics show DB saturation
        ↓
Infrastructure metrics show CPU increase
        ↓
Logs identify slow query
        ↓
Engineer finds root cause
This is observability-driven performance engineering.
Don’t Treat Logs as Unlimited Storage
Centralized logs are valuable, but they can contain sensitive information.
The release documentation specifically highlights using Grafana secrets management and redaction when handling secrets that could accidentally appear in logs. The --no-cloud-logs option provides an opt-out when cloud log streaming is not appropriate. (github.com)
That gives QA teams an important security question:
Should every test log be sent to the cloud?
Not necessarily.
Build a policy.
Sensitive Environment?
      ↓
Yes → Review / redact / disable cloud logs
      ↓
No → Centralized logs may be enabled
Performance engineering and security engineering should not operate as separate worlds.
Geographic Load is Part of Realism
The k6 cloud load-zone list command can help teams inspect available cloud load zones.
But listing load zones is only the beginning.
You need to connect geography with user distribution.
For example:
Users
 ├── 50% Europe
 ├── 30% North America
 └── 20% Asia-Pacific
Your performance test should ideally reflect the important traffic distribution.
Otherwise:
Production Geography
       ≠
Test Geography
and your latency conclusions may be misleading.


Build a Geographic Performance Hypothesis
Before running a multi-region test, make a prediction.
For example:
Users in Region A will experience higher latency because the primary application infrastructure is hosted far from that region.
Then test it.
Hypothesis
   ↓
Load Test
   ↓
Regional Metrics
   ↓
Compare
   ↓
Confirm / Reject
This makes performance testing scientific rather than observational.
You are no longer merely collecting numbers.
You are testing an engineering hypothesis.
Experimental Feature Flags Need Controlled Evaluation
The new experimental flags deserve a separate validation approach.
For example:
merge-run-tags
freeze-env
Treat experimental capabilities as isolated experiments.
Create a branch:
git checkout -b experiment/k6-2-2-features
Then enable the feature only for the relevant test.
Document:
Feature:
Expected behavior:
Observed behavior:
Potential risk:
Performance impact:
CI impact:
Decision:
This prevents experimental functionality from silently becoming a production dependency.
Build a Performance Test Matrix
A mature QA team should test across dimensions rather than running one giant load test.
For example:
| Dimension | Example Values |
|---|---|
| Load | 100, 500, 1,000, 5,000 VUs |
| Region | US, Europe, APAC |
| Browser | Chromium |
| Environment | QA, staging |
| Duration | 5m, 15m, 30m |
| Scenario | Login, search, checkout |
| Version | Baseline, k6 2.2.0 |
This produces a test matrix.
But do not execute every combination blindly.
Prioritize combinations that represent real production risks.
Find the Breaking Point
A performance test should sometimes intentionally push the system beyond its expected capacity.
For example:
100 VUs   → Stable
500 VUs   → Stable
1,000 VUs → Stable
2,000 VUs → Increasing latency
5,000 VUs → Threshold failure
This helps identify capacity limits.
The goal is not simply:
“The test failed.”
The useful conclusion is:
“The system maintained the target performance envelope until approximately this workload under these environmental conditions.”
That is actionable capacity information.
Distinguish Saturation From Failure
Suppose p95 latency increases from:
300 ms
↓
350 ms
↓
450 ms
↓
700 ms
while CPU approaches:
55%
↓
65%
↓
78%
↓
95%
The performance degradation may be associated with resource saturation.
But do not assume CPU is automatically the root cause.
Correlate:
CPU
Memory
Database
Network
Application latency
Error rate
Queue depth
Performance engineering requires correlation across layers.
CI/CD Should Enforce Performance Expectations
Do not keep performance testing separate from software delivery forever.
A mature pipeline can include:
Pull Request
    ↓
Functional Tests
    ↓
Build
    ↓
Deployment
    ↓
Performance Smoke
    ↓
Threshold Validation
    ↓
Release
For example:
k6 run performance-smoke.js
If thresholds fail, the pipeline can stop.
That turns performance requirements into delivery controls.
Avoid Making Every CI Build a Full Load Test
This is another common mistake.
A practical model is:
Every Build
    ↓
Small Performance Smoke

Nightly
    ↓
Medium Load Test

Scheduled
    ↓
Large Regression Test

Before Major Release
    ↓
Full Capacity Test
This gives teams continuous feedback without turning every commit into an expensive load-testing operation.
Think in Performance Budgets
Performance budgets can be defined just like frontend or API quality budgets.
For example:
p95 API latency       < 500 ms
p99 API latency       < 1,000 ms
Error rate            < 1%
Checkout latency      < 800 ms
Critical transaction  > 99.9% success
Then make those requirements visible.
The performance test becomes a contract between:
QA
+
Developers
+
DevOps
+
Product
Everyone understands what “acceptable” means.
A Useful Exercise for QA Engineers
Take one critical business journey from your application.
For example:
Login → Search → Product → Cart → Checkout
Now answer these questions:
- How many users perform this journey per minute?
- What percentage of traffic follows this path?
- Which APIs are involved?
- What is the expected p95 latency?
- What is the acceptable error rate?
- Where are the users located?
- Which infrastructure components could become bottlenecks?
- What logs and metrics would identify the root cause?
- Which browser journeys need validation?
- Which parts should run continuously in CI?
If your team cannot answer these questions, writing a larger load script will not solve the underlying problem.
The Strategic Upgrade Question
After exploring the capabilities in k6 2.2.0, the best upgrade question is not:
“Can we install it?”
Of course you can.
Ask instead:
“Does k6 2.2.0 improve our ability to generate realistic workloads, observe failures, test browser behavior, control execution environments, and make reliable performance decisions?”
For teams using Grafana Cloud, browser testing, distributed load generation, and CI/CD performance gates, the answer may be particularly compelling.
For simpler API-only test suites, the value may be incremental.
That is why the correct recommendation is not universal.
It should be based on your architecture, your performance risks, and your measurable baseline.
Building a Production-Grade k6 2.2.0 Performance Strategy
k6 2.2.0 Released with capabilities that make it worth reconsidering how performance tests are structured, especially when the test suite needs to operate across local execution, cloud observability, browser automation, distributed load generation, and CI/CD.
The biggest mistake teams can make is treating a performance-testing framework upgrade as an installation task.
A better approach is to treat the upgrade as an opportunity to inspect the entire performance engineering lifecycle.
Create a Baseline Before Changing Anything
Before upgrading your existing k6 environment, capture a baseline.
Start with:
k6 version
Then execute a representative workload and record:
Test version:
Virtual users:
Request rate:
Test duration:
p50:
p90:
p95:
p99:
Error rate:
Threshold results:
CPU:
Memory:
Cloud logging:
Browser execution:
For example:
Baseline

k6: 2.1.x
VUs: 500
Duration: 10m
p95: 420 ms
p99: 760 ms
Errors: 0.32%
After upgrading, execute the same workload under the same conditions:
Candidate

k6: 2.2.0
VUs: 500
Duration: 10m
p95: 415 ms
p99: 745 ms
Errors: 0.28%
Do not immediately conclude that the new version improved application performance.
The application did not necessarily become faster.
Your test environment changed.
The correct conclusion is:
“The workload produced comparable or improved measurements under the new k6 environment.”
That distinction protects teams from false performance conclusions.
Use Repeatability as Your First Quality Gate
A performance test should be repeatable enough that engineers can distinguish meaningful changes from normal variation.
Run the same test multiple times:
k6 run performance-test.js
k6 run performance-test.js
k6 run performance-test.js
Then compare the distributions.
A useful mental model is:
Test A
   ↓
Test B
   ↓
Test C
   ↓
Variation Range
   ↓
Expected Baseline
If your results vary wildly between runs, upgrading k6 is not your biggest problem.
Your test environment may be unstable.
Possible causes include:
- shared CI infrastructure
- noisy neighbors
- unstable network conditions
- inconsistent application data
- changing backend dependencies
- autoscaling behavior
- cache state
- database state
Performance engineering begins with experimental control.
Validate the Test Tool Before Blaming the Application
This is one of the most useful habits for QA engineers.
When a performance test fails, ask three questions:
Did the application fail?

Did the test infrastructure fail?

Did the workload model create an artificial failure?
For example:
Threshold Failure
      ↓
Investigate
      ↓
Application latency?
      │
      ├── Yes → Application investigation
      │
      └── No
          ↓
       Generator CPU?
          ↓
       Network?
          ↓
       Browser resource usage?
A load generator running out of CPU can create misleading results.
The application may be healthy while the generator becomes the bottleneck.
Understand Generator Saturation
Suppose you generate 20,000 requests per second.
Your k6 worker reaches 100% CPU.
Latency suddenly increases.
It is tempting to report:
“The application cannot handle 20,000 requests per second.”
That conclusion may be wrong.
The actual situation could be:
k6 Generator
    ↓
CPU = 100%
    ↓
Generator cannot create more load
    ↓
Observed request rate becomes unstable
The correct question is:
Did the application saturate, or did the load generator saturate first?
This is why performance infrastructure needs monitoring too.
Compare k6 With JMeter and Locust Strategically
Tool comparisons are most useful when they are connected to engineering decisions.
| Area | k6 | JMeter | Locust |
|---|---|---|---|
| Primary model | Code-first | GUI/configuration-heavy | Python-code-first |
| Language | JavaScript | Java ecosystem | Python |
| CLI workflow | Excellent | Strong | Excellent |
| Git workflow | Excellent | Good | Excellent |
| Browser capability | Available | More specialized | Available through ecosystem |
| Grafana integration | Strong | Possible through integrations | Possible through integrations |
| Distributed testing | Strong | Strong | Strong |
| Developer adoption | Strong | Mature enterprise adoption | Strong Python adoption |
| Best fit | Modern performance engineering | Broad protocol/load testing | Python-centric teams |
There is no universal winner.
The better tool is the one that fits your organization’s:
- language ecosystem
- CI/CD architecture
- observability platform
- performance expertise
- test maintenance model
- cloud strategy
- application architecture
A Java-heavy enterprise may already have deep JMeter expertise.
A Python-heavy engineering team may prefer Locust.
A JavaScript-oriented DevOps organization using Grafana may find k6 especially natural.
That is a strategic decision, not a popularity contest.
Treat Browser Performance as a Separate Workload Class
One of the most important lessons from modern performance testing is that API load and browser load should not automatically be treated as equivalent.
Consider:
API Test

10,000 VUs
   ↓
HTTP Requests
   ↓
Backend
Now compare:
Browser Test

50 Browser Users
   ↓
Chromium
   ↓
JavaScript
   ↓
DOM
   ↓
Network
   ↓
Backend
The resource profile is completely different.
A browser consumes significantly more client-side resources.
Therefore, the number of browser users should be chosen based on realistic user behavior rather than an arbitrary desire to generate a huge number of browser instances.
Use a Layered Performance Model
A mature test portfolio can look like this:
                 Performance Strategy
                         │
        ┌────────────────┼────────────────┐
        ↓                ↓                ↓
      API Load       Browser Tests    Capacity Tests
        │                │                │
     High VUs         Low VUs         Increasing VUs
        │                │                │
        └────────────────┼────────────────┘
                         ↓
                   Shared Backend
                         ↓
                   Observability
This model gives each test a purpose.
API Load Test
Answers:
Can backend services handle expected traffic?
Browser Test
Answers:
Can realistic browser journeys perform acceptably?
Capacity Test
Answers:
Where does the system begin to violate its performance objectives?
The tests complement one another.
They should not be forced into one giant scenario.
Use chromium.connectOverCDP() Where It Adds Value
The new browser connection capability can be especially useful when Chromium is already managed externally.
A conceptual workflow is:
CI Container
    ↓
Start Chromium
    ↓
Expose CDP
    ↓
k6 connects
    ↓
Execute browser scenario
This architecture can be useful when teams need custom browser startup behavior.
For example, the external browser process may have specialized:
- command-line flags
- networking configuration
- container settings
- debugging configuration
- authentication setup
The key is to keep the architecture intentional.
If your normal k6 browser workflow is already simple and reliable, adding external lifecycle management may create more complexity than value.
Ask the Architecture Question
Before adopting CDP connectivity, ask:
Does our test require a browser that already exists?

        ↓

Does another system need to control Chromium?

        ↓

Do we need that separation for CI or infrastructure reasons?

        ↓

Yes → Evaluate CDP

No → Prefer the simpler model
This decision tree prevents feature-driven architecture.
Centralized Logs Improve Team Collaboration
The cloud-log improvements are particularly useful when several engineering roles participate in performance investigations.
Imagine a test executing locally from a CI runner.
Without centralized logs:
CI Runner
   ↓
Local Logs
   ↓
Engineer must access runner
With centralized visibility:
CI Runner
   ↓
k6 Execution
   ↓
Grafana Cloud
   ↓
QA + SDET + DevOps + Developers
That changes the collaboration model.
A developer does not necessarily need access to the machine that generated the test.
The performance engineer can share the same test-run context with the rest of the team.
Add Log Governance to Your Performance Strategy
Centralized logging also introduces governance requirements.
Performance scripts frequently handle:
- authentication tokens
- user identifiers
- API payloads
- session information
- test credentials
Therefore, teams should review what enters logs.
A simple policy could be:
Performance Logs
      ↓
Sensitive Data?
      │
      ├── Yes → Redact / sanitize
      │
      └── No → Centralize
If cloud logging is not appropriate for a particular workload, the release provides:
k6 cloud run --local-execution --no-cloud-logs script.js
The important principle is:
Observability should improve debugging without creating a security problem.
Use Load Zones to Test Real Geography
Performance numbers are strongly influenced by network distance.
Imagine an application hosted primarily in Europe.
A test generated from Europe may produce:
p95 = 220 ms
A test generated from another continent may produce:
p95 = 480 ms
Both numbers can be correct.
The difference is geography.
This is why the ability to inspect cloud load zones matters.
k6 cloud load-zone list
The command helps you discover the available locations before designing a geographically distributed workload.
Build a Regional Test Model
Suppose production traffic looks like:
Europe       50%
North America 30%
Asia-Pacific 20%
Your test design could approximate that distribution.
Conceptually:
             Global Workload
                    │
        ┌───────────┼───────────┐
        ↓           ↓           ↓
     Europe       America      APAC
       50%          30%          20%
        │           │           │
        └───────────┼───────────┘
                    ↓
               Application
This provides a much stronger representation of production demand than simply generating all traffic from one location.
Test Regional Hypotheses Instead of Just Collecting Numbers
Before a multi-region test, write a hypothesis.
For example:
“APAC users will experience higher p95 latency because the primary application region is located in Europe.”
Then test it.
Hypothesis
    ↓
Regional Workload
    ↓
Measure
    ↓
Compare
    ↓
Investigate
    ↓
Decision
This is a much stronger scientific approach than opening a dashboard after the test and searching for something interesting.
Introduce Capacity Testing
A load test answers:
How does the system behave under a defined workload?
A capacity test asks:
How much workload can the system handle before it violates its performance objectives?
For example:
100 VUs
   ↓
Stable

500 VUs
   ↓
Stable

1,000 VUs
   ↓
Stable

2,000 VUs
   ↓
p95 increases

3,000 VUs
   ↓
Threshold failure
You have now identified a performance boundary.
The useful output is not simply:
"3,000 VUs failed."
It is:
“Under the tested environment and workload model, the system maintained the target performance envelope up to approximately 2,000 VUs.”
That is an engineering result.
Find the Knee of the Curve
A useful capacity-testing technique is to look for the point where additional load causes disproportionate performance degradation.
Conceptually:
Latency
  │
  │                 /
  │              __/
  │           __/
  │        __/
  │_____ _/
  └──────────────────── Load
             ↑
        Saturation zone
Before saturation:
More Load
   ↓
Small Latency Increase
After saturation:
More Load
   ↓
Large Latency Increase
That transition is often more valuable than a simple maximum-throughput number.
Combine Application and Infrastructure Metrics
Never analyze k6 metrics in isolation for serious performance investigations.
Consider:
k6
├── Request Rate
├── p95
├── p99
└── Error Rate

Application
├── CPU
├── Memory
├── Thread Pool
└── Request Queue

Database
├── Query Latency
├── Connections
└── CPU

Infrastructure
├── Network
├── Container CPU
└── Autoscaling
Now imagine:
p95 ↑
CPU ↑
DB connections ↑
DB latency ↑
You have a much stronger investigation path than if you only knew that p95 increased.
Use Performance Testing as a Diagnostic System
The most mature teams do not ask:
“Did the test pass?”
They ask:
“What did the test teach us about the system?”
A useful result could be:
Finding:
Checkout p95 increases sharply above 1,500 VUs.

Evidence:
Database connection utilization reaches 92%.

Recommendation:
Review checkout database connection pool and query behavior.

Regression Gate:
p95 must remain below 800 ms at 1,000 VUs.
That is actionable.
A green/red result alone is not.
Integrate Performance Into CI/CD Carefully
Not every performance test belongs in every pipeline.
A practical model is:
Pull Request
     ↓
Performance Smoke
     ↓
Nightly
     ↓
Regression Load
     ↓
Weekly
     ↓
Capacity Test
     ↓
Release
     ↓
Full Performance Validation
For a lightweight smoke test:
k6 run performance-smoke.js
The test might contain only a small number of virtual users and a few critical transactions.
The objective is early detection, not capacity analysis.
Keep Heavy Tests Out of Developer Feedback Loops
Imagine every pull request starts a 30-minute distributed load test.
Developers will eventually stop caring about the result.
Performance automation must balance:
Coverage
+
Execution Cost
+
Feedback Speed
+
Signal Quality
A better strategy is layered:
| Test Type | Frequency | Purpose |
|---|---|---|
| Performance smoke | Every relevant build | Detect obvious regressions |
| API load | Nightly | Detect performance drift |
| Browser performance | Scheduled | Validate user journeys |
| Capacity | Weekly/on demand | Discover system limits |
| Release validation | Before major release | Confirm production readiness |
This creates sustainable performance engineering.
Use Experimental Flags as Controlled Experiments
The experimental merge-run-tags and freeze-env capabilities should be evaluated separately from your stable test foundation.
Create an isolated branch:
git checkout -b experiment/k6-2-2
Document the experiment:
Feature:
Purpose:
Expected behavior:
Observed behavior:
CI impact:
Performance impact:
Rollback plan:
Decision:
Then make the adoption decision based on evidence.
This is particularly important for critical performance suites where reproducibility matters more than having the newest capability.
Build a k6 Upgrade Checklist
Before adopting k6 2.2.0 broadly, verify:
[ ] Version installed correctly
[ ] Existing scripts execute
[ ] Thresholds behave as expected
[ ] API tests pass
[ ] Browser tests pass
[ ] Chromium integration works
[ ] CI execution works
[ ] Cloud execution works
[ ] Local execution works
[ ] Cloud logs are reviewed
[ ] Sensitive data is protected
[ ] Load zones are appropriate
[ ] Dashboards still work
[ ] Performance baseline is comparable
[ ] Experimental features remain isolated
Then compare the results with your baseline.
A Practical Upgrade Experiment
If you manage a production-scale QA environment, create three validation stages.
Stage 1: Functional Compatibility
Run:
k6 run smoke.js
Validate:
- script execution
- checks
- thresholds
- authentication
- data handling
Stage 2: Performance Compatibility
Run the same controlled workload against the same environment.
Record:
p50
p90
p95
p99
error rate
request rate
Stage 3: Infrastructure Compatibility
Validate:
CI
Cloud
Browser
Logs
Load Zones
Dashboards
Only after all three stages pass should the new version become the default for the wider team.
Make the Upgrade Reversible
Never make a performance framework upgrade difficult to roll back.
For npm-based project management, keep the version explicit in your project:
{
  "devDependencies": {
    "k6": "2.2.0"
  }
}
The exact installation mechanism depends on how your organization manages k6, but the broader principle is important:
Pin infrastructure versions when reproducibility matters.
Do not let every developer or CI worker silently receive a different test-engine version.
Version Drift Can Corrupt Test Comparisons
Imagine:
Developer A → k6 2.1.x
CI → k6 2.2.0
Performance Lab → k6 2.0.x
Now your results may differ because of infrastructure versions rather than application changes.
That makes trend analysis harder.
A stronger setup is:
Repository
    ↓
Pinned Version
    ↓
CI
    ↓
Performance Lab
    ↓
Consistent Test Engine
Reproducibility is essential when performance results become release evidence.
The Most Important Upgrade Metric Is Not Version Number
After adopting a new performance-testing version, ask whether it improved engineering outcomes.
Track:
Mean Time to Diagnose
Test Failure Rate
Flaky Test Rate
CI Failure Rate
Performance Regression Detection
Test Execution Time
Cloud Visibility
Browser Test Coverage
Regional Coverage
For example:
Before

MTTD: 45 minutes
Cloud visibility: Partial
Browser coverage: Limited

After

MTTD: 25 minutes
Cloud visibility: Centralized
Browser coverage: Expanded
That is a meaningful upgrade.
The goal is not:
“We are using the newest k6.”
The goal is:
“Our performance engineering process is more reliable and more useful.”
Interactive Challenge for QA Engineers
Take your most important performance test and answer these questions:
1. What workload does it represent?

2. What production traffic does it represent?

3. Where does the load originate?

4. What are the p95 and p99 objectives?

5. What happens when the workload doubles?

6. Can you distinguish generator saturation
   from application saturation?

7. Can your team access execution logs centrally?

8. Can you reproduce the same test tomorrow?

9. Can CI automatically detect a regression?

10. Can you explain the root cause of a failure?
If you cannot answer several of these questions, the biggest improvement may not be another test script.
It may be improving the performance-testing system around the script.
A Better Mental Model for k6
Think of k6 as several connected capabilities rather than a single load generator:
                 k6
                  │
      ┌───────────┼───────────┐
      ↓           ↓           ↓
   API Load    Browser     Cloud
      │           │           │
      └───────────┼───────────┘
                  ↓
            Observability
                  ↓
             CI/CD Gates
                  ↓
          Engineering Decision
That model makes the changes in k6 2.2.0 easier to understand.
Cloud logs improve visibility.
Chromium connectivity expands browser integration.
Load-zone discovery improves geographic test planning.
Web-platform APIs improve scripting flexibility.
Experimental flags provide additional capabilities for teams willing to validate them carefully.
None of these features replaces good test design.
They amplify it.
What QA Engineers Should Do Differently
If your organization is considering k6 2.2.0, focus on five practical actions:
First, baseline your existing tests.
Without baseline data, upgrade validation becomes guesswork.
Second, separate workload types.
Do not use browser tests for everything or API tests for everything.
Third, centralize observability.
A failed threshold tells you that something happened. Logs, metrics, traces, and infrastructure telemetry help explain why.
Fourth, make geography intentional.
Load should originate from locations that represent your users and architecture.
Fifth, measure the engineering outcome.
A successful upgrade should make your performance-testing process more reliable, diagnosable, reproducible, or useful.
That is a much stronger definition of success than simply installing a newer version.
From k6 2.2.0 Adoption to a Reliable Performance Engineering System
k6 2.2.0 Released with improvements that are useful beyond individual test scripts. The real opportunity for QA engineers is to use these capabilities to build a performance-testing system that is repeatable, observable, geographically realistic, and connected to engineering decisions.
A modern performance strategy should answer five questions:
What are we testing?
        ↓
How much load are we generating?
        ↓
Where is the load coming from?
        ↓
How do we know what happened?
        ↓
What decision will the result trigger?
If the last question has no answer, the test may be producing metrics without producing engineering value.
Build Performance Gates Around Risk
Not every endpoint deserves the same performance threshold.
A health-check endpoint may tolerate a different latency target from checkout, authentication, search, or payment.
Define thresholds according to business importance:
export const options = {
  thresholds: {
    http_req_duration: [
      'p(95)<500',
      'p(99)<1000'
    ],

    http_req_failed: [
      'rate<0.01'
    ]
  }
};
For a critical transaction, you can model more specific checks:
import http from 'k6/http';
import { check } from 'k6';

export default function () {
  const response = http.post(
    'https://example.test/api/checkout',
    JSON.stringify({
      productId: '12345',
      quantity: 1
    }),
    {
      headers: {
        'Content-Type': 'application/json'
      }
    }
  );

  check(response, {
    'checkout returns success': (r) => r.status === 200,
    'checkout responds under 800ms':
      (r) => r.timings.duration < 800
  });
}
The strategic difference is important.
A generic test asks:
Did the requests finish?
A performance gate asks:
Did this critical business operation remain within its agreed performance budget?
That is much more valuable.
Connect Performance Results to Business Risk
Consider two APIs:
| API | p95 | Business Impact |
|---|---|---|
| Product recommendations | 900 ms | Moderate |
| Checkout | 900 ms | High |
The same latency number does not necessarily represent the same risk.
A better prioritization model is:
Performance Risk
=
User Impact
×
Business Criticality
×
Traffic Volume
×
Failure Cost
You do not need to calculate this as a literal mathematical formula.
Use it as a thinking framework.
Ask:
- How many users experience this?
- Does it block a critical workflow?
- Does failure create revenue loss?
- Is the operation latency-sensitive?
- Can users recover from the failure?
This helps QA teams spend performance-testing effort where it matters most.
Use the Right Test at the Right Stage
A common anti-pattern is trying to make one enormous performance test do everything.
Instead, build a layered strategy.
Developer Feedback
        ↓
Performance Smoke
        ↓
Nightly Load Test
        ↓
Scheduled Browser Test
        ↓
Capacity Test
        ↓
Release Validation
Each layer answers a different question.
| Test | Main Question | Typical Frequency |
|---|---|---|
| Smoke | Did an obvious regression appear? | Frequent |
| Load | Does expected traffic work? | Daily/Scheduled |
| Browser | Do critical user journeys perform? | Scheduled |
| Stress | What happens beyond expected load? | Scheduled |
| Capacity | Where is the performance boundary? | Periodic |
| Release | Is the system ready? | Major releases |
This approach is more sustainable than executing maximum-scale testing for every build.
Don’t Confuse Load, Stress, and Soak Testing
These test types have different purposes.
Load Testing
You simulate expected or forecasted traffic.
Expected Load
      ↓
System
      ↓
Measure Performance
Stress Testing
You deliberately exceed expected demand.
Expected
   ↓
Higher
   ↓
Higher
   ↓
Failure Boundary
Soak Testing
You maintain sustained load for an extended period.
Moderate Load
     ↓
     ↓
     ↓
Hours
     ↓
Memory Leaks?
Resource Exhaustion?
Performance Drift?
A system may pass a short load test while failing a long-duration soak test.
That is why test objectives must be defined before choosing the workload.
Use k6 2.2.0 Browser Capability Without Losing API Coverage
Browser testing is useful, but it should complement rather than replace protocol-level load testing.
For example:
              Application
                   │
        ┌──────────┴──────────┐
        ↓                     ↓
   API Workload          Browser Journey
        ↓                     ↓
  High Concurrency       Real Interaction
        ↓                     ↓
        └──────────┬──────────┘
                   ↓
              Shared Services
The API workload can generate large amounts of traffic.
The browser workload can validate critical user experience.
This is particularly useful for applications where frontend behavior and backend capacity are both important.
Compare the Roles of k6, Playwright, and Selenium
QA engineers often have several automation tools already available.
The question should not be:
Which tool should replace everything?
Instead:
Which tool should own which testing problem?
| Tool | Strongest Role | Performance Use |
|---|---|---|
| k6 | Load/performance engineering | Primary |
| Playwright | Modern browser automation | Browser performance scenarios |
| Selenium | Broad browser automation | Primarily functional/browser automation |
| Cypress | Developer-centric web testing | Primarily functional/e2e |
| JMeter | Protocol/load testing | Load and performance |
| Locust | Python-based load testing | Load and performance |
This leads to a practical architecture:
Functional UI
   ├── Playwright / Selenium / Cypress

API Functional
   ├── API automation

Performance
   ├── k6

Observability
   ├── Grafana ecosystem
Tools become complementary instead of competing for ownership.
Use connectOverCDP() as an Infrastructure Boundary
The browser connectivity capability introduced in k6 2.2.0 is particularly interesting when browser lifecycle management belongs somewhere else.
For example:
CI/CD
  ↓
Container
  ↓
Chromium
  ↓
CDP
  ↓
k6
  ↓
Browser Scenario
This architecture can be useful when the organization already has standardized Chromium infrastructure.
But there is an important design principle:
Do not introduce an infrastructure boundary unless it solves an infrastructure problem.
If k6 can reliably manage the browser lifecycle itself, keep the architecture simpler.
Use CDP when external lifecycle management gives you a measurable advantage.
Make Your Performance Tests Environment-Aware
The same script can produce completely different results depending on the environment.
Consider:
Development
   ↓
Small Database
   ↓
Few Instances
versus:
Production-like
   ↓
Distributed Database
   ↓
Autoscaling
   ↓
CDN
   ↓
Multiple Services
A performance result from a weak environment should not automatically be interpreted as a production-capacity prediction.
Document the environment:
Environment:
Application version:
Database version:
Infrastructure:
Instance count:
CPU:
Memory:
Region:
Network:
Caching:
Autoscaling:
Without this context, performance numbers lose much of their meaning.
Treat Test Data as Part of Performance Infrastructure
Data can dramatically affect results.
For example, a search test using ten identical values may produce unrealistic cache behavior.
A better approach is to maintain representative test data:
const users = [
  'user001@example.test',
  'user002@example.test',
  'user003@example.test',
  'user004@example.test'
];

const user =
  users[Math.floor(Math.random() * users.length)];
For larger workloads, use data pools rather than uncontrolled randomness.
The goal is:
Realistic Data
      ↓
Realistic Requests
      ↓
Realistic Application Behavior
Performance scripts are only as realistic as the data they send.
Protect Secrets in Performance Tests
Performance scripts frequently require credentials, tokens, or environment-specific configuration.
Avoid hard-coding secrets:
const username = __ENV.TEST_USERNAME;
const password = __ENV.TEST_PASSWORD;
Then execute with environment variables:
k6 run \
  -e TEST_USERNAME="$TEST_USERNAME" \
  -e TEST_PASSWORD="$TEST_PASSWORD" \
  performance.js
The exact secret-management mechanism should follow your organization’s security platform.
The principle is universal:
Performance automation should not become a secret-distribution mechanism.
This becomes even more important when logs are centralized.
Treat Cloud Logs as Observability Data
The cloud-log improvements in k6 2.2.0 can make troubleshooting easier, but QA teams should define what belongs in those logs.
A useful observability model is:
Metrics
   +
Logs
   +
Traces
   +
Infrastructure Data
   =
Performance Investigation
For example:
k6 p95 ↑
     ↓
Application latency ↑
     ↓
Database query latency ↑
     ↓
Database CPU ↑
     ↓
Slow query identified
The performance test becomes a diagnostic entry point rather than just a pass/fail mechanism.
Create an Incident Investigation Playbook
When a performance threshold fails, do not start randomly searching dashboards.
Use a consistent sequence:
1. Confirm test validity
        ↓
2. Confirm load-generator health
        ↓
3. Check application latency
        ↓
4. Check error rate
        ↓
5. Check infrastructure saturation
        ↓
6. Check database/cache/network
        ↓
7. Correlate timestamps
        ↓
8. Identify probable root cause
        ↓
9. Reproduce
        ↓
10. Document finding
This reduces mean time to diagnose.
It also makes performance investigations easier for engineers who did not create the original test.
Build a Failure Classification System
Not every failed performance test is an application defect.
Classify failures.
Performance Failure
        │
        ├── Application
        │     ├── Slow API
        │     ├── Database
        │     └── Memory
        │
        ├── Infrastructure
        │     ├── CPU
        │     ├── Network
        │     └── Scaling
        │
        ├── Test Generator
        │     ├── CPU
        │     └── Memory
        │
        ├── Test Data
        │
        └── Test Configuration
This simple model prevents teams from filing an application defect every time a threshold fails.
Use Load Zones to Challenge Architecture
Geographic testing should not simply prove that one region works.
Use it to challenge architectural assumptions.
Suppose your application uses:
Users
 ↓
Global CDN
 ↓
Regional API
 ↓
Primary Database
Ask:
What happens when users are far from the primary data region?
Then measure:
Regional p50
Regional p95
Regional p99
Error rate
Network latency
Backend latency
You may discover that the application is technically healthy while users experience poor latency because of network distance.
That is a performance architecture issue, not necessarily an application-code issue.
Create a Performance Experiment Notebook
For important performance tests, record the experiment.
A simple format:
Experiment:
Date:
Application Version:
k6 Version:
Environment:
Hypothesis:
Workload:
Regions:
Expected Result:
Observed Result:
Anomalies:
Root Cause:
Recommendation:
For example:
Hypothesis:
Checkout p95 will remain below 800 ms at 1,000 VUs.

Observed:
p95 = 740 ms.

At 1,500 VUs:
p95 = 1,140 ms.

Evidence:
Database connection utilization reached 94%.

Recommendation:
Investigate connection pool sizing.
This transforms test results into reusable engineering knowledge.
Use Historical Trends
One performance run is rarely enough.
Track results over time:
Release 1.0 → p95 420 ms
Release 1.1 → p95 430 ms
Release 1.2 → p95 470 ms
Release 1.3 → p95 560 ms
The trend reveals something a single run cannot.
A performance regression may be gradual.
Therefore, store:
Version
p50
p95
p99
Error Rate
Throughput
Infrastructure Metrics
Then compare releases.
The objective is to detect performance drift before it becomes a production incident.
Make Performance a Release Signal
A mature release pipeline can combine:
Functional Quality
       +
Security
       +
Performance
       +
Reliability
       =
Release Confidence
For example:
Functional tests      PASS
Security checks       PASS
Performance smoke     PASS
Performance baseline  PASS
Critical thresholds   PASS
The release decision becomes evidence-based.
Don’t Optimize for the Best Number
This is a subtle but important lesson.
Teams sometimes celebrate:
p95 improved from 500 ms to 400 ms
without asking what changed.
Maybe caching increased dramatically.
Maybe the test data changed.
Maybe traffic was reduced.
Maybe a downstream dependency was mocked.
Maybe the test ran from a different region.
A good performance engineer asks:
Why did the number change?
Not:
Is the number lower?
Performance optimization requires causality.
Challenge: Explain One Performance Regression
Take a real performance result from your test suite.
Suppose:
Version A
p95 = 380 ms

Version B
p95 = 620 ms
Before filing a defect, investigate:
Application change?
Database change?
Infrastructure change?
Load change?
Data change?
Region change?
k6 version change?
Browser version?
Cache state?
If you can explain the difference with evidence, you have performed engineering analysis rather than merely reporting a regression.
Build an Upgrade Decision Matrix
For k6 2.2.0, use a decision model such as:
| Question | Yes | No |
|---|---|---|
| Need improved local/cloud log visibility? | Prioritize evaluation | Lower priority |
| Need browser/CDP flexibility? | Prioritize evaluation | Lower priority |
| Need multi-region load planning? | Evaluate load zones | Lower priority |
| Need newer web-platform APIs? | Evaluate | Lower priority |
| Need experimental capabilities? | Controlled experiment | Ignore for now |
| Existing suite is stable? | Baseline first | Baseline still recommended |
This avoids upgrading simply because a new version exists.
When Should You Upgrade?
A sensible recommendation for most QA organizations is:
Upgrade in a controlled environment first.
The release has no reported breaking changes, which reduces migration risk, but teams should still validate their own scripts, CI environment, browser workflows, cloud integration, dashboards, thresholds, and performance baselines.
Prioritize the evaluation if your organization uses:
- Grafana Cloud k6
- local cloud execution
- browser-based performance scenarios
- Chromium infrastructure
- multi-region testing
- CI/CD performance gates
For a mature, stable API-only suite, the release may be more of an incremental improvement than an urgent migration.
A Production-Ready Upgrade Workflow
Use this workflow:
Current k6
    ↓
Capture Baseline
    ↓
Install 2.2.0
    ↓
Run Smoke Tests
    ↓
Run Representative Load
    ↓
Validate Browser Tests
    ↓
Validate Cloud Execution
    ↓
Review Logs
    ↓
Validate Load Zones
    ↓
Compare Metrics
    ↓
Review CI/CD
    ↓
Approve Rollout
Keep the previous version available until the validation is complete.
The upgrade should be reversible.
Measure the Upgrade by Engineering Outcomes
After adoption, compare outcomes rather than simply checking the version number.
Track:
| Metric | Before | After |
|---|---|---|
| Test execution time | Baseline | Compare |
| Failure diagnosis time | Baseline | Compare |
| CI failures | Baseline | Compare |
| Cloud visibility | Baseline | Compare |
| Browser coverage | Baseline | Compare |
| Regional coverage | Baseline | Compare |
| Performance regression detection | Baseline | Compare |
If these metrics improve, the upgrade is delivering organizational value.
If they do not, ask whether the new capabilities are actually solving a problem your team has.
The Strategic Lesson for SDETs
The most important lesson from k6 2.2.0 is not a particular CLI command or browser API.
It is the mindset behind the release.
Modern performance engineering connects:
Realistic Workloads
       ↓
Reliable Execution
       ↓
Distributed Load
       ↓
Browser Scenarios
       ↓
Centralized Observability
       ↓
Performance Budgets
       ↓
CI/CD Gates
       ↓
Engineering Decisions
A performance-testing framework becomes much more valuable when every metric has a purpose.
A p95 value should tell you whether a requirement was met.
A load-zone result should tell you something about geographic behavior.
A browser test should tell you something about user experience.
A log should help explain a failure.
A threshold should trigger a decision.
That is how performance testing evolves into performance engineering.
Interactive Performance Engineering Checklist
Before calling your performance-testing strategy mature, challenge your team with these questions:
[ ] Can we reproduce our important tests?

[ ] Do we have a documented baseline?

[ ] Are workloads based on production behavior?

[ ] Are our thresholds tied to business requirements?

[ ] Do we monitor the load generator?

[ ] Do we test geographic differences?

[ ] Do we separate API and browser workloads?

[ ] Can we investigate failures using centralized telemetry?

[ ] Do we protect credentials and sensitive data?

[ ] Can CI detect meaningful regressions?

[ ] Do we track performance trends across releases?

[ ] Can we identify application saturation
    versus test-infrastructure saturation?

[ ] Is our k6 version controlled and reproducible?

[ ] Do we have a rollback strategy?

[ ] Does every major performance test
    produce an actionable engineering conclusion?
If most answers are “yes,” your team is moving beyond basic load testing.
If several answers are “no,” that gap represents an opportunity to improve the performance engineering system around your tests.
AI Overview / Answer Engine Optimization
k6 2.2.0 is a performance-testing release that adds improved Grafana Cloud log streaming for local execution, Chromium CDP connectivity, new web-platform capabilities, load-zone discovery, and experimental feature flags. The release has no reported breaking changes, but QA teams should validate existing scripts, CI/CD workflows, browser tests, cloud execution, and performance baselines before broad adoption.
People Asked Questions
What is k6 2.2.0?
k6 2.2.0 is a performance-testing release from Grafana that introduces improved cloud log streaming for local execution, Chromium CDP connectivity, new web-platform capabilities, load-zone discovery, and experimental feature flags.
What are the main features of k6 2.2.0?
The major updates include:
- Cloud logs for
k6 cloud run --local-execution chromium.connectOverCDP()- Global
TextEncoderandTextDecoder WritableStreamsupport ink6/experimental/streamsk6 cloud load-zone list- New
merge-run-tagsandfreeze-envexperimental flags
Does k6 2.2.0 have breaking changes?
No. According to the release information, k6 2.2.0 has no breaking changes. However, QA teams should still validate existing performance scripts, CI/CD pipelines, browser scenarios, thresholds, and cloud integrations before adopting it broadly.
Should QA engineers upgrade to k6 2.2.0?
For most teams, a controlled upgrade is recommended rather than an immediate organization-wide rollout. Teams using Grafana Cloud, browser performance testing, distributed load testing, or local cloud execution may benefit particularly from the new capabilities.
What is chromium.connectOverCDP() in k6?
chromium.connectOverCDP() allows k6 browser tests to connect to an already-running Chromium instance through the Chrome DevTools Protocol (CDP). This can be useful when browser lifecycle management is handled externally by CI/CD or infrastructure tooling.
How does k6 2.2.0 improve Grafana Cloud logging?
With k6 cloud run --local-execution, k6 2.2.0 can stream test logs to Grafana Cloud. This makes logs from locally executed cloud tests available in the cloud test-run view instead of keeping them exclusively on the local machine.
Can cloud log streaming be disabled?
Yes. Teams can opt out of cloud log streaming by using:
k6 cloud run --local-execution --no-cloud-logs script.jsThis can be useful when centralized logging is not appropriate for a particular test or when teams need stricter control over test-run data.
What does k6 cloud load-zone list do?
The command lists available Grafana Cloud load zones. QA engineers can use this information when designing geographically distributed performance tests that better represent the locations of real users.
Is k6 better than JMeter?
Neither tool is universally better. k6 is particularly strong for code-first performance testing, developer workflows, Git-based test management, CI/CD, and Grafana observability. JMeter remains a mature choice with extensive protocol support and enterprise adoption. The right choice depends on the team’s architecture and testing requirements.
Can k6 2.2.0 be used for browser performance testing?
Yes. k6 supports browser-based performance scenarios, and k6 2.2.0 adds chromium.connectOverCDP() for connecting to an already-running Chromium instance. Browser tests should complement high-volume API load tests rather than replace them.
How should a QA team validate a k6 2.2.0 upgrade?
A practical validation process is:
Capture baseline
      ↓
Install k6 2.2.0
      ↓
Run smoke tests
      ↓
Run representative load
      ↓
Validate browser tests
      ↓
Validate cloud execution
      ↓
Review logs and thresholds
      ↓
Compare performance metrics
      ↓
Validate CI/CD
      ↓
Approve rollout
Internal Links
- k6 2.1.0 Released: Why QA Engineers Should Upgrade for Better Performance Testing
- k6 2.0.0 Released: Important Breaking Changes QA Engineers Must Know
- k6 2.0.0 Released: What Performance Engineers Must Fix NOW
- Grafana K6 1.7.1 Released — What’s New for QA Engineers
Official Resources
- Official Release Notes: https://github.com/grafana/k6/releases/tag/v2.2.0
- Official Documentation: https://grafana.com/docs/k6/latest
Conclusion
k6 2.2.0 Released with improvements that are particularly relevant to teams building modern performance-testing workflows. The value is not limited to individual features such as cloud log streaming, chromium.connectOverCDP(), load-zone discovery, or new experimental capabilities.
The bigger opportunity is architectural.
QA engineers and SDETs can use these capabilities to create performance tests that are more observable, more realistic, more reproducible, and more closely connected to CI/CD and business requirements.
The strongest strategy is not to generate the largest possible amount of traffic.
It is to generate meaningful traffic, from meaningful locations, against a representative environment, while collecting enough evidence to explain why the system behaved the way it did.
That is the difference between running a load test and practicing performance engineering.
Final Key Takeaways
- k6 2.2.0 Released without reported breaking changes, making controlled evaluation relatively low risk.
- Cloud log streaming can improve visibility for local-execution workflows.
chromium.connectOverCDP()provides additional flexibility for externally managed Chromium environments.k6 cloud load-zone listsupports better geographic load-test planning.- API load and browser performance testing should complement each other rather than compete.
- Performance thresholds should represent measurable engineering or business requirements.
- Always capture a baseline before changing your performance-testing infrastructure.
- Monitor the load generator so infrastructure saturation is not mistaken for application failure.
- Use centralized metrics, logs, traces, and infrastructure telemetry for root-cause analysis.
- Treat experimental capabilities as controlled experiments rather than immediate production dependencies.
- Integrate lightweight performance checks into CI/CD while reserving heavy capacity tests for scheduled execution.
- Track performance trends across application releases instead of judging quality from a single test.
- The success of a k6 upgrade should be measured by better reliability, observability, diagnosis, reproducibility, and engineering decision-making, not merely by the version number.
Continue Learning
Explore more expert articles on n8n, Autogen, Postman AI, Cursor AI, LangChain, CrewAI, MCP Servers, AI Agents, LlamaIndex, Docker, FastAPI, Playwright, Cypress, Test Automation, DevOps, and Software Engineering at www.skakarh.com.
QAPulse by SK delivers expert release analysis, AI engineering insights, enterprise automation strategies, migration guidance, DevOps best practices, and practical testing knowledge to help software professionals build scalable, intelligent, and production-ready software systems.